From “Ugh” to “Ooh!” – Reframing Logic Models
“Ugh, they’re making us submit a logic model? What is the point of a logic model anyway?
“I don’t understand all that technical jargon. What am I supposed to put in a logic model?”
These are the thoughts I imagine my clients having when a funder or state department of education requires them to create a logic model … and rightfully so.
Logic models are often overly complicated, far too technical, and not connected to ACTUAL practice – so it’s no wonder that they are not intuitive for people doing “the work” in education.
It doesn’t have to be that way though. Let’s talk about what a logic model actually is and how it can help your organization.
I found the following definition of a logic model on the Community Tool Box (emphasis added):
“A logic model presents a picture of how your effort or initiative is supposed to work… Effective logic models make an explicit, often visual, statement of the activities that will bring about change and the results you expect to see for the community and its people. A logic model keeps participants in the effort moving in the same direction by providing a common language and point of reference.”
Here’s what I love about this definition:
1) It clearly conveys that a logic model is a visualization of how your program operates, and
2) It helps teams see that a logic model can actually streamline their work and make sure everyone is on the same page.
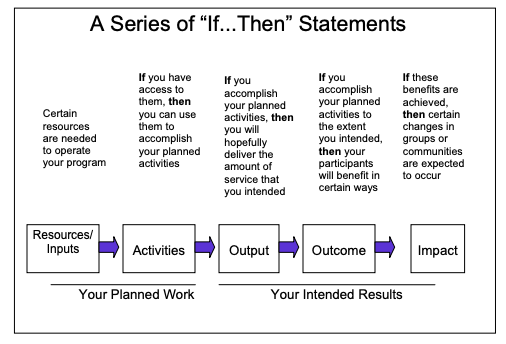
The image below from the CDC is another great way to think about what a logic model can do.

So instead of an annoying task you have to complete for grant funding, think of a logic model as a dynamic map of your program and how you will collaboratively work towards achieving your goal.
Recently, I introduced this new way of thinking to a school district team I’m working with.
I’m designing a data dashboard (learn more here!) for them so that all of their family-serving teams can share data and serve their district’s families more efficiently. (I’m really excited about this.)
When we met with each team individually, they were all saying the same things about how they engage with families and what data they already or want to track.
Yet, collectively, they couldn’t see the forest for the trees. They didn’t know how similarly each team was operating!
Let me be clear: this wasn’t because they were not communicating or working together. It’s because they didn’t have a framework to guide their collective work and show where there was overlap across project teams.
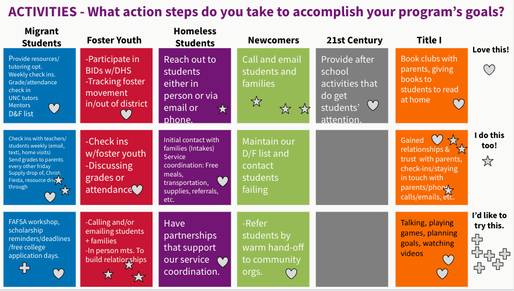
So we got to work. Using Google Slides, we did an interactive work session where the teams brainstormed what they would put in each part of a logic model. Below is a screenshot of their “Activities” brainstorm.

Then we did a virtual “gallery walk” so they could see how much overlap there was. See how many “I do this too” stars there are in the image?
After this, it took no time to put together their ideas into a more traditional logic model format.
If your team is currently struggling with making a logic model, don’t be afraid!
Reframing how we think about logic models can go a long way towards making them purposeful, usable tools to make our family engagement work more effective.