• Skip to main content
  • Skip to footer
  • Home

The May 13 Group

the next day for evaluation

  • Get Involved
  • Our Work
  • About Us
You are here: Home / Archives for allblogs / engagewithdata

engagewithdata

Sep 20 2020

Tips and Tricks for Great Survey Design … and a Survey for You

We have all taken TONS of surveys in our lifetime. 

We get surveys when we make an online purchase, when we speak with a customer service agent, when we want to get a  free gift card, and even when we go to the hospital. 

We’re all pros at taking surveys… and we all know when we’re taking one that’s TERRIBLY designed. 

For me, if I don’t feel like I can answer the questions, or if it gets too long or overly annoying, I’m out. 

And that organization just lost a respondent. 

I don’t want that to happen to you — because in education, surveying our stakeholders is SO important. It shows that we value our stakeholders’ opinions, feedback, and experiences. 

We can’t afford to lose respondents because of iffy survey design. 

Here are a few of my tips for upping your survey game: 

1. Ask only what’s really important. 

Make a list of what your team is wondering about or what the impact of your proposed projects/plans might be before you draft your survey questions. 

Keep it short and sweet … if it’s not related to those things, don’t include it. 

2. Reach respondents where they are. 

Think of all of your touch points with your key stakeholders. Students may be log in for online class, families may check social media for updates, and all of your stakeholders may access meal sites.

At all of these venues, you can easily ask about needs, satisfaction with the school’s efforts, or other questions you may have.

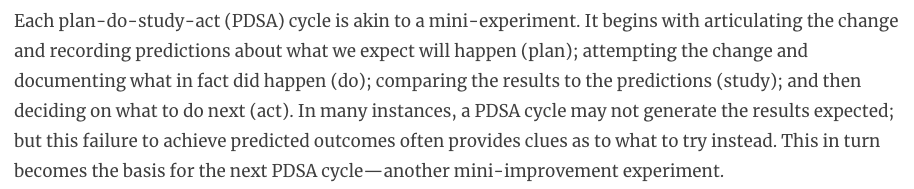
You can also get feedback through polls in Google Classroom, Zoom, via text message, or even on social media. 

3. This may seem obvious, but … make it easy for respondents to actually answer your questions. 

Keep the language clear and simple so a person of any reading level can understand it. 

Never ask about more than one topic in a single question, and try to avoid giving a neutral middle answer option when you can.

(In both of these cases, it’s very hard for you to actually learn anything from the data.)

And of course, if you work with communities who speak languages other than English, find a way to translate your survey into their language. 

Translation is a much tougher process than it should be, but it is essential for making all of your families feel valued and for hearing from your entire community, not just one subset. 

All that being said, I feel the same way about you – my colleagues, clients, and readers.

I want to know what’s important to you and what would be helpful for me to cover on the blog.

I hope that you’ve been inspired by this post and will take my brief survey below.

​I appreciate your feedback and will use it to generate future content for you!

Loading…

Written by cplysy · Categorized: engagewithdata

Sep 09 2020

Start the School Year By Hearing from Stakeholders

Growing up in New Jersey, the day after Labor Day always marked the start of a new school year … and the day I finally got to wear the new outfit I had carefully planned and crack open my new, pristine notebooks.

If you couldn’t tell, I have always loved the excitement of returning to school. 

Unfortunately, for many children, families, and educators, this year felt different. 

Some of the usual excitement and jitters have been replaced by trepidation about what to expect from a year like no other.

Concerns about health and safety, academic progress, and schedule juggling have been abundant in my conversations with teachers and the staff and family surveys I have analyzed. 

So how will schools and districts know if they are adequately addressing their stakeholders’ fears?

Well… they’ve got to ask them. 

Colleagues in a number of recent conversations have been discussing the use of continuous improvement cycles. If you’re not familiar with continuous improvement, its hallmark is the Plan-Do-Study-Act (PDSA) Cycle.  

Picture

Alicia Grunow of the Carnegie Foundation for the Advancement of Teaching explains the PDSA cycle: 
Picture

More simply put, schools and districts need to: 

  • Determine what need or concern they are going to address and how they will address it, 
  • Implement the intervention, program, or practice they proposed, 
  • Collect and analyze data to see if what was implemented actually worked, and
  • Make a plan for what to continue and what to change. 

Then, the cycle starts all over again … quickly. 

We’re not talking about huge, multi-year studies here … This is a relatively quick and simple process! 

Make a plan, implement the plan, figure out if the plan worked, and if not, adjust and try again! 

With school kicking off, schools and districts have already put a short-term plan in place and are putting it into action. 

And this year, short cycles of trial and error are going to be key, as even our modes of schooling could change multiple times throughout the year. 

So how can schools and districts get feedback from their stakeholders NOW to see if their plan worked? 

Instead of a lengthy formal survey, think of creative ways to ask for feedback:​

  • Polls in Google Classroom or Zoom for students during or after class
  • Fun tools like PollEverywhere or Mentimeter that can help you embed polls into presentations and display the results 
  • Create a poll on Twitter or other social media platforms from your school or district
Picture

Asking one or two questions at a time in interactive ways will make it easy for stakeholders of all groups to participate, prevent them from getting tired of surveys, and give you real-time data about how people are feeling.*

*Just make sure the platforms you choose will allow for translation.

Now here’s the kicker: once you collect on data, you have to complete the cycle … ACT!

Make it clear for students, families, and staff that you valued their feedback and are going to put it to use … and tell them how!

Start this crazy school year off right by lifting up the voices of your stakeholders in fun and easy ways and demonstrating that their feedback will guide your next round of planning and action. 

Written by cplysy · Categorized: engagewithdata

Aug 24 2020

The “How” of Data Tracking: Conditional Formatting

I’ve written a lot lately (here and here) about WHY tracking your school or organization’s data is so critical right now.

As schools begin to reopen, I’ve heard from educators of so many different configurations for what school is going to look like: some totally virtual, some in person, some in a hybrid model… 

That’s a lot to keep track of!

It’s hard enough to make sure that no child falls through the cracks when school is operating as usual — now that task seems herculean. 

So how can we be sure that we know where each student stands, even if we don’t see them every day?

How can we know that we’re doing our best to meet their needs (and that we even know what those needs are)? 

That, my friends, is where some simple data tracking strategies come in. 

Here is one trick to help you assess, at a glance, which students or families need a little more support: conditional formatting. 

Conditional formatting allows you to set criteria to automatically color-code or highlight values that you need to take action on.

You’ll see that my (totally fictitious) dataset below is just a typical spreadsheet — nothing stands out at a glance, and it’s hard to see which of these students really needs the most attention. 

We can use conditional formatting to visually highlight some of the students who need some support. We can find it by clicking selecting the text we want to format, and then clicking on the circled icon below.

Picture

Once you click on the icon, you’ll see a drop-down menu pop up with all of the options you have for automatically color-coding your data. I think the easiest way to start is by selecting “New Rule.”
Picture

In the menu that pops up to manage your rules, you’ll set the criteria that will determine what gets color-coded and how you want to code it. 

​This is where things get fun. 
Picture

The simplest option is “Classic.” I always choose “Format cells that contain” and set either a text or numerical value that I want to highlight. Below is how I highlighted the students whose Quarter 3 grades were below a 70. 
Picture

And voila! Now you can see, at a glance, the students who were struggling in Quarter 3. No fancy statistical skills needed!

I could also create other rules for my high-performing students or those ones that fell in the middle of the class.

Picture

There are TONS of other ways to conditionally format your data — here are two other examples for the same data that address the whole range of grades.

On the left, you’ll see that instead of the Classic mode, I used an Icon Set to do a little traffic light system for the student grades. On the right, I used Data Bars to help me see students’ grades on a scale from the lowest to highest score.

Picture

Picture

With these formatting options, I can see the students that might need some extra support… and it only took a few clicks and a decision about the point at which I’d be concerned about a student. 

This is just one strategy of many that can help you quickly and easily to make sure no students are falling through the cracks. 

Want to learn more? 

  • Schedule an Excel workshop (or three!) for your organization – check out the descriptions from my three-part series here. 
  • Sign up here for the free Evidence for Engagement mini-course! It will walk you through how to become an evidence-based organization. 
  • Pencil this into your calendar: Evidence for Engagement is going live! On September 16 at 3:00 EST, Tamara Hamai and I will be leading a workshop on how to use data to ensure that you’re still making an impact, even if your services have gone virtual. More information coming soon!

None of these work for you? Schedule a free 30-minute consultation with me so we can figure out how to best get your data tracking system started!
​

Written by cplysy · Categorized: engagewithdata

Aug 14 2020

Don’t Be Like Myers-Briggs: Measure Your Impact

When I started my doctoral program at Vanderbilt, I certainly didn’t expect to get into a … heated discussion, shall we say? … with the professor of my first course. 

We were discussing characteristics of effective leaders, and our professor mentioned that the Myers-Briggs Type Indicator, one of the most well-known personality tests, was essentially worthless.

You see, despite its incredible popularity, there is actually no data to show that Myers-Briggs is a valid and reliable assessment — that it measures what it intends to, and that you’d consistently get the same outcomes if you took it again and again. 

Now, I’ve always been a pretty introspective person, and I (still) love personality tests as a fun way to reflect on how I think, feel, and interact with others. I’d never taken them as a scientific assessment of my psyche, but Myers-Briggs especially had stood out to me as a somewhat revelatory framework for why people interact and act the way they do.

I had always gotten the exact same result when I’d taken the Myers-Briggs (ENFJ, if you’re curious), so when my professor started talking about how most people get quite different results each time they take it, and that there was no research to support its utility, part of me was bummed, and part of me was fired up. 

I argued (civilly, of course) that I didn’t use it as a formal diagnostic tool, but instead as a helpful resource or an interesting way of looking at things. So why should it matter? (Newsflash: It does matter.)

For fun, I recently read The Personality Brokers: The Strange History of Myers-Briggs and the Birth of Personality Testing by Merve Emre. Of course, she confirmed what my professor had said many years ago. However, it reminded me of something I see often in education. 

People who are passionate about helping children and families often feel that they KNOW that what they’re doing is helping the communities they serve, even without any real data to back it up. 

We KNOW that our Family Science Night was a success because there were lots of families there, and everyone enjoyed themselves. We BELIEVE that a teacher is effective because the children love them. We FEEL the impact of an after-school program because, well, it’s been in the community forever. 

Unfortunately, we can’t rely on gut instincts, feelings, and beliefs alone to tell us if something is effective… just like I couldn’t make decisions based on only an affinity for Myers-Briggs. 

Let me be clear: education, and family engagement in particular, tends to get kind of fuzzy. While we can’t rely on intuition, it’s also true that we can’t rigorously test everything that happens in schools. We need to find a middle ground.

But this isn’t just my random interest in personality theory. 

When it comes to children and families, we need to make sure that what we’re doing to try to help them actually works. 

Luckily, it’s not that hard to get started. We can begin tracking data, analyzing trends, and ultimately, measuring our impact so that we know we aren’t just THINKING that we’re changing lives. We actually are. 

If you need help getting started with building your evidence base, the Evidence for Engagement email series is back! Learn more and sign up so you can begin your evidence journey. 

Written by cplysy · Categorized: engagewithdata

Jul 29 2020

Now is the time.

Fear. Uncertainty. Frustration. Isolation. 

In recent conversations with districts across the country and in analyses of surveys for clients, these words have come up a lot. Families, educators, and community members are feeling a whole lot of unpleasant things as we grapple with how – or if – we can simultaneously facilitate safety and high-quality learning experiences in our nation’s schools.

Instead of shopping sprees at Staples (oh, how I wish!), we are experiencing back-to-school season like never before. Reopening plans change so quickly we can’t keep up, and districts are scrambling to ensure that the safety protocols can be met and that all students can actually access and benefit from remote learning. My conversations and analyses lately have shown me how palpable and salient these fears and questions are for so many people. 

The good news? While no one really knows what will happen with COVID, we do have some ways to alleviate the feelings I listed above. Think about these: Communication. Relationships. Empathy. Engagement. 

Let’s be honest: we have always needed these things. However, with most districts going fully or partially remote this fall, the role of families in children’s education is even more prominent than before. For those of us who have long promoted the critical nature of family and community engagement, we’ve been saying to ourselves lately, “Now’s our time.”

It’s time for family engagement to be a priority for all educators, community members, and policymakers, not an afterthought. We must lift up the voices of families, truly hear what they have to say, and use their feedback as a key driver for decisions moving forward. 

It’s time for us to leverage the wealth of resources in our communities to support families who are struggling right now. In my city, I was pleased to see that the City of Columbus and Columbus City Schools have agreed to spend $7 million of the CARES Act funds on providing Chromebooks for every student and wifi hotspots for families who lack internet access.

It’s time to embrace partnerships with organizations who can help make learning fun, interactive, and accessible. Here’s an example of how one of my favorite local institutions, the Center of Science and Industry (COSI), is facilitating the exploration of science for children in under-resourced communities. 

It’s time for us to focus our energy and public dollars on practices that have been proven effective and to put systems in place to begin tracking our progress. AttendanceWorks has done a great job of bringing data tracking to the forefront as we work to ensure that all students have an equitable school experience this fall.

More than anything, it’s time for us to dismantle barriers created by historical and institutionalized racism and to embrace all children and families as our own. We need to be unafraid to check our privilege, acknowledge racist policies and practices, and work to rectify harm that has been done. If you’re not sure where to get started, here is a free training on implicit bias for K-12 educators from the Kirwan Institute on the Study of Race and Ethnicity at Ohio State (I attended an incredibly powerful trainings with them this week.).

As we continue to weather the uncertainty from COVID, we need to remember that we all have the ability to communicate effectively, build meaningful relationships, empathize with others, and engage families in partnership. With these priorities and a plan for how to measure if we’re doing them right, we will be able to help all children, families, and communities make the most of this unconventional back-to-school time. 

How are institutions and organizations near you embracing engagement during this time?

Written by cplysy · Categorized: engagewithdata

  • « Go to Previous Page
  • Go to page 1
  • Interim pages omitted …
  • Go to page 5
  • Go to page 6
  • Go to page 7
  • Go to page 8
  • Go to page 9
  • Interim pages omitted …
  • Go to page 11
  • Go to Next Page »

Footer

Follow our Work

The easiest way to stay connected to our work is to join our newsletter. You’ll get updates on projects, learn about new events, and hear stories from those evaluators whom the field continues to actively exclude and erase.

Get Updates

Want to take further action or join a pod? Click here to learn more.

Copyright © 2026 · The May 13 Group · Log in

en English
af Afrikaanssq Shqipam አማርኛar العربيةhy Հայերենaz Azərbaycan dilieu Euskarabe Беларуская моваbn বাংলাbs Bosanskibg Българскиca Catalàceb Cebuanony Chichewazh-CN 简体中文zh-TW 繁體中文co Corsuhr Hrvatskics Čeština‎da Dansknl Nederlandsen Englisheo Esperantoet Eestitl Filipinofi Suomifr Françaisfy Fryskgl Galegoka ქართულიde Deutschel Ελληνικάgu ગુજરાતીht Kreyol ayisyenha Harshen Hausahaw Ōlelo Hawaiʻiiw עִבְרִיתhi हिन्दीhmn Hmonghu Magyaris Íslenskaig Igboid Bahasa Indonesiaga Gaeilgeit Italianoja 日本語jw Basa Jawakn ಕನ್ನಡkk Қазақ тіліkm ភាសាខ្មែរko 한국어ku كوردی‎ky Кыргызчаlo ພາສາລາວla Latinlv Latviešu valodalt Lietuvių kalbalb Lëtzebuergeschmk Македонски јазикmg Malagasyms Bahasa Melayuml മലയാളംmt Maltesemi Te Reo Māorimr मराठीmn Монголmy ဗမာစာne नेपालीno Norsk bokmålps پښتوfa فارسیpl Polskipt Portuguêspa ਪੰਜਾਬੀro Românăru Русскийsm Samoangd Gàidhligsr Српски језикst Sesothosn Shonasd سنڌيsi සිංහලsk Slovenčinasl Slovenščinaso Afsoomaalies Españolsu Basa Sundasw Kiswahilisv Svenskatg Тоҷикӣta தமிழ்te తెలుగుth ไทยtr Türkçeuk Українськаur اردوuz O‘zbekchavi Tiếng Việtcy Cymraegxh isiXhosayi יידישyo Yorùbázu Zulu