• Skip to main content
  • Skip to footer
  • Home

The May 13 Group

the next day for evaluation

  • Get Involved
  • Our Work
  • About Us
You are here: Home / Archives for allblogs / engagewithdata

engagewithdata

Dec 17 2020

Word Clouds and Key Quotations: Making Qualitative Data Work for You

This week I’ve got a co-author to help me continue my qualitative data series! 

Sarah Dunifon is Founder and Principal Evaluator of Improved Insights LLC, an educational evaluation firm focused on STEM and youth-based programming. She is based in Cleveland, Ohio and is a fellow board member of the Ohio Program Evaluators Group. 
​

We hope you enjoy our post below.

Qualitative data can be a bit elusive.

It’s not usually too hard to find data for things that are measurable. We know we can do surveys, or count the number of attendees, or track patterns over time.

Qualitative data though – the context for those numbers – often takes a little more work to track down. Of course, we can always do interviews and focus groups with stakeholders to learn about their experiences, our usual go-to’s.

However, if you think of qualitative data for what it is – simply put, another information source – you’ll find that so many other forms of it are hiding in plain sight.

Think about the chatbox in your last Zoom session – you may not have realized it, but that’s a source of qualitative data! Other sources you may have readily available include the phone call logs that your teachers keep when they call families or even the observations you did of an event (online, drive-up, or fully in-person).

If you need more, there are lots of ways of collecting qualitative data, and many of them are even more prevalent now in our almost fully virtual world. 

This makes our lives a lot easier, as we prepare to write our annual reports, apply for grants, or share the impact that our program had during this unusual year.

Like I mentioned in my last post, sharing the context for our quantitative findings can make those reports tell a much richer story.

Yet it’s not always intuitive to know how to turn a whole bunch of text into these powerful programmatic insights.

So when you find these sources of qualitative data, what do you do with them?

We can actually find patterns in our data by assigning thematic codes to different words, phrases, or even images. Sometimes, you start with a set of codes that have to do with your program goals, or the research concepts underlying your program.

Other times, you just code as you go. If you start to see a lot of mentions of a particular topic, that topic can become a code.

Coding can take many forms, and there is fancy software that can help you do it, but sometimes all you need is a notebook and some markers or a color-coded spreadsheet.
​

Below you can see some sample data about an after-school program focused on science and animals that we’ve color-coded according to the themes we saw.

Picture

In one glance, you can see that our participants liked a lot of aspects of the program, but games and activities (in blue) and the food (in pink), got the most mentions.

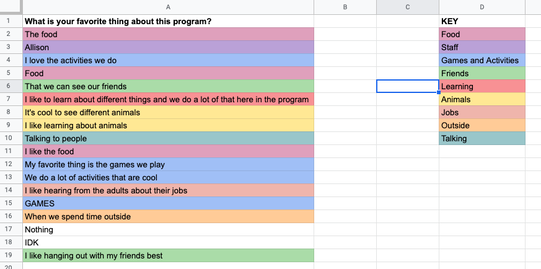
Coding allows us to see what’s happening across the dataset and pull out themes or key insights that we need to highlight.

Sharing your qualitative data analysis can be an important addition to your data story when demonstrating the impact of your work. It can add relevance, personality, and context to quantitative data by illustrating individual effects.

By reviewing our datasets systematically, we can also find some incredible quotes – the kind you would never attempt to paraphrase if you were writing a paper because they were so perfectly worded — and let our stakeholders’ words shine.

You can feature key quotations by offsetting them or putting them in a different color in your report to highlight individual experiences and catch readers’ attention.

Another popular way to display qualitative data is in a word cloud.

Word clouds are visual representations of keywords that come up frequently in a set of qualitative data. Typically, the bigger the word, the more frequently it appeared in a data set.

There are plenty of critiques of word clouds in the data visualization space and rightly so – word clouds can often obscure meaning rather than clarify it. So if you are going to use them, here are three things you should know:

1. Give the data a good cleaning to remove anything that you don’t want represented in the visual.
Here, we’d recommend removing any responses that do not give value (e.g., “idk,” “I’m not sure,” “Nothing,” etc.) as well as any text surrounding the main themes (e.g., “I like the […],” “I love […],” “my favorite thing is […],” etc.).

2. Consider the messages or key points you see in the data that you wish to convey visually. If it is possible to condense themes further or pull out important words, now is the time to do so.
This might mean collapsing phrases as best as possible to a single word, or perhaps a few words of important meaning. 

3. Make sure to keep the essence of the data – meanings can be misconstrued when collapsing phrases into single words or shorter phrases.
If you’re finding this is happening, perhaps a word cloud is not the best way to display your data.

However, with data cleaning and basic analysis, the word cloud can change drastically.

Take a look here at three versions of the same word cloud we generated on WordItOut using the data we shared earlier. The first was created with original – or “raw” – data, the second with cleaned data, and the third with some basic analysis and condensing.
​
Notice how the prominent words change with each version, and how the meaning and key messages can shift.

Picture

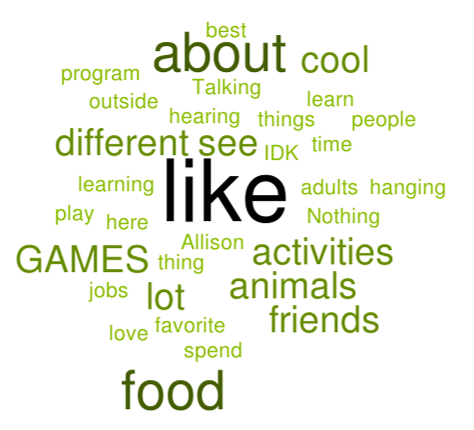
Word Cloud 1 – Original Data
Picture

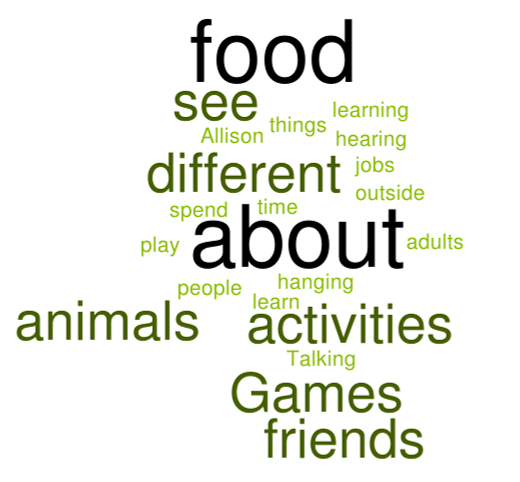
Word Cloud 2 – Cleaned Data
Picture

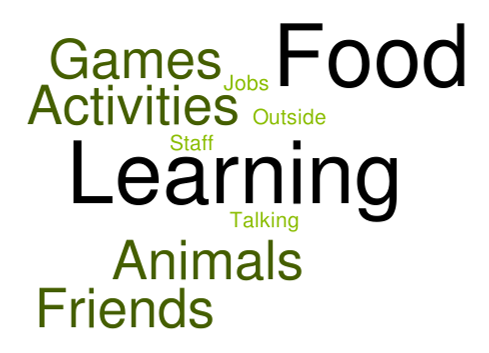
Word Cloud 3 – Basic Analysis
As you can see, while word clouds are one of the most accessible forms of qualitative data displays, they take some work to be most effective.

However, word clouds aren’t your only option. Data visualization experts like Stephanie Evergreen, Storytelling with Data, and Depict Data Studio all have great resources on different qualitative data displays.
​
The case is clear – with some simple analysis and visualization, qualitative data can be a powerful addition to your data story.

Written by cplysy · Categorized: engagewithdata

Dec 01 2020

Numbers Can’t Tell the Whole Story

You should know by now that I’m a bit of a data nerd. 

I love spreadsheets. I love organizing data and using it to illuminate patterns. I love the “ah-ha” moments when clients realize how much their own data can tell them about the kids and families they’re serving. 

So it may surprise you that I’m here to say that numbers and spreadsheets don’t tell us everything. 

That doesn’t mean that numbers (or quantitative data) are irrelevant. 

It just means that they are even more informative when paired with stories, quotations, or anecdotes (qualitative data). 

(See the box for a quick refresher on the difference between the two). 

Quantitative Data

  • Numerical information
  • Can be condensed to numbers and statistics
  • Can be aggregated, combining data to look at the highest level (Ex. school-wide) or disaggregated, to look at the smallest level (Ex. student-level data)

Qualitative Data

  • Contextual information
  • Can be gained from interviews, focus groups, and observations
  • Can be analyzed and condensed into patterns and trends or used as case studies or anecdotes from individual people or schools
Here’s an example. Yesterday, I was re-reading an article from The Columbus Dispatch, my local paper, about the spike in youth violence that has occurred during the pandemic.

It’s been horrible to hear about how many children and teens (well, really anyone, for that matter) have been victims of gun violence since the spring.

The article cites a number of statistics — that the number of children treated in Columbus for gunshot wounds this spring and summer was double the rate from 2019 (from 16 to 32); and that children from racial or ethnic minorities are twice as likely to be shot than white children. 

Those are AWFUL statistics – and they certainly help me see that there is a dire situation here. 

But then, the article talks to a teacher whose student — an eight year-old boy — was killed. Here’s what the article shares about (and from) the teacher: 
​

Thalgott has lost a handful of former students during her 20 years of teaching on the South Side. She’s seen even more students who have lost a parent to gun violence. 
​

“The sad thing is it no longer shocks me,” Thalgott said. “And that’s what is scary. How have we let this get to the point where it is no longer shocking?”

​Having lost some former students or their family members to gun violence — either as victims or perpetrators — this quote really gets to me.

This quote conjures up such raw emotions that suddenly it puts the statistics they cited into context. 

Those 32 children are somebody’s child, somebody’s sibling, somebody’s student, somebody’s mentee. Hearing from a person who actually experienced that loss made a big difference in how I processed this article. I imagine it did for you too. 

Quantitative data can be so powerful, but its impact is amplified when we lift up the voices of those we are serving or studying. 

Qualitative data — gathered through interviews, focus groups, open-ended survey questions, or observations — can sometimes more effectively communicate the experience ​of what is happening in your school or community.

I’ll be doing a series of posts on qualitative data over the next few weeks — how to collect it, how to use it, and how using a combination of data can truly help you tell your story.

Written by cplysy · Categorized: engagewithdata

Nov 02 2020

Five years!

Five years ago this week, I took the leap. 

I was a Community School Coordinator (CSC) in Baltimore and a doctoral student, and it was time for a change. 

You see, my data tracking spreadsheets were starting to catch on among other CSCs. I kept thinking, “How amazing would it be if helping schools use data to track and improve their engagement efforts could be my JOB?”

The problem was, that job didn’t seem to exist. So I made it myself.

After much research, networking, and careful planning, I officially started Structured Solutions in November 2015 and went full-time after the new year. 

What a journey it has been! Owning a business surely has its ups and downs, but there have been far more ups for me. 

Over the past five years, I have: 

  • Worked with approximately 20 organizations in 10 different states (see the map below);
  • Presented at six national conferences or virtual events and four state conferences or events;
  • Built a national network of fellow evaluators and family engagement experts; 
  • Gotten to be creative and follow my passions; and
  • Been honored to support and empower the people doing the REAL work helping children and families thrive. 

While I am a “solopreneur,” if you will, I certainly could not have done this alone. What I feel this week is gratitude for the people who took chances on me, supported me, and challenged me, as well as for the many opportunities that I have been given. ​

I am excited for what the next five years bring. 

P.S. PLEASE VOTE TOMORROW!

Written by cplysy · Categorized: engagewithdata

Oct 20 2020

We can’t let them fall through the cracks.

I started writing a completely different blog post for this week, but when I read the news this morning, I knew I had to shift gears. 

CNN featured a story yesterday called “​Teachers and social workers search for students who are ‘missing’ in the pandemic.”

The word “missing” made my heart drop. 

It immediately reminded me of this story, of a young girl from Washington, DC named Relisha Rudd. I heard about her story in 2014, and it broke my heart — at the time, I was a community school coordinator and led our school’s charge for attendance and engagement tracking and interventions. Staff from Relisha’s school tried to track her down, only to find that a man working at the homeless shelter where she was staying had been impersonating her doctor to the school.

She is still missing to this day. 

As a community school coordinator, her story lit a fire under me to do everything I could to make sure that we knew, to the best of our ability, that our kids were safe and able to come to school. 

I have thought of Relisha over the years and find the tragedy of her story to be a call to action for schools, districts, and other youth- and family-serving organizations. 

How can we make sure that no other students fall through the cracks?

When I read the story this morning about the Robla School District in California doing home visits and trying everything they can to find their students “missing” from online school, I had so many thoughts:

Labeling students as “missing” drives home the gravity of the situation our country is in. Families are truly struggling because of the virus and the economy, but honestly, lacking access to the internet, to stable housing, and to consistent work have been challenges for so many families for so long. The fact that things are only getting worse is upsetting and shows us that we have so much work to do. 

Literally going into neighborhoods searching for children is heroic, but also emotionally grueling. I remember the disappointment and worry of having a string of unsuccessful home visits — you gear yourself up for making a difference, only to find that addresses were incorrect or have changed, or worse — you just don’t know where students and families are living. That is scary, and it is emotionally taxing for educators. 

While data tracking can’t help us physically locate a family, it can help us focus our efforts where they are needed most. You may have seen that last week, I released a guide for how to Track Your Engagement Data in 4 Simple Steps. I believe strongly that using simple functions in Excel can help educators pinpoint exactly which students and families need additional support — whether that’s with attendance, engagement, or academics. 

(I know it can work because I’ve seen the impact it has had on my own work in schools!)

So in honor of Relisha and in commitment to the well-being and success of students who may be “missing” from online school today, let’s get tracking. 

To learn more about data tracking, visit my Engage with Excel page or sign up below. 

Written by cplysy · Categorized: engagewithdata

Oct 05 2020

Survey Fails … and How to Recover from Them

Sometimes you launch a survey, and you’re blown away by the number of responses you get. 

And sometimes, you’re not. 

I had one of these moments last week.

I was SUPER excited to try something new with my blog and launch a survey to hear what readers wanted to see in future posts. 

I sent out my blog to my email list, waiting with bated breath (okay, maybe I’m being dramatic) for all of the responses to pour in. 

… And then I realized that the survey I embedded didn’t even show up in the email. 

INSERT FACE PALM EMOJI.

Let’s just say that I didn’t get the response rate I was hoping for. 

But here’s the thing – it’s okay to have a survey fail. All hope is not lost.

If you don’t get the response rate you were hoping for, take a step back and consider: 

  • Did you use channels of communication that your target audience prefers?
  • Did you make the purpose (and value) of your survey clear in your messaging?
  • Is your survey designed in a way that makes it easy for your respondents to complete?
  • Did technical issues make it hard for your audience to complete the survey?
  • Does your audience just need a reminder?
  • Do you still have time to send it out again?

For me, technical issues definitely got the best of my survey attempt, but I also think a reminder wouldn’t hurt. 

So here’s my plug:

I’d love to know more about what you want to learn! I’d appreciate if you could take a minute to share your thoughts and preferences with me. I’ll report the results and use them to make this blog even more beneficial for you. 

The survey is embedded below, but if it’s not loading for you, click the button to go right to it. 

Take me to the survey!

Loading…

Written by cplysy · Categorized: engagewithdata

  • « Go to Previous Page
  • Go to page 1
  • Interim pages omitted …
  • Go to page 4
  • Go to page 5
  • Go to page 6
  • Go to page 7
  • Go to page 8
  • Interim pages omitted …
  • Go to page 11
  • Go to Next Page »

Footer

Follow our Work

The easiest way to stay connected to our work is to join our newsletter. You’ll get updates on projects, learn about new events, and hear stories from those evaluators whom the field continues to actively exclude and erase.

Get Updates

Want to take further action or join a pod? Click here to learn more.

Copyright © 2026 · The May 13 Group · Log in

en English
af Afrikaanssq Shqipam አማርኛar العربيةhy Հայերենaz Azərbaycan dilieu Euskarabe Беларуская моваbn বাংলাbs Bosanskibg Българскиca Catalàceb Cebuanony Chichewazh-CN 简体中文zh-TW 繁體中文co Corsuhr Hrvatskics Čeština‎da Dansknl Nederlandsen Englisheo Esperantoet Eestitl Filipinofi Suomifr Françaisfy Fryskgl Galegoka ქართულიde Deutschel Ελληνικάgu ગુજરાતીht Kreyol ayisyenha Harshen Hausahaw Ōlelo Hawaiʻiiw עִבְרִיתhi हिन्दीhmn Hmonghu Magyaris Íslenskaig Igboid Bahasa Indonesiaga Gaeilgeit Italianoja 日本語jw Basa Jawakn ಕನ್ನಡkk Қазақ тіліkm ភាសាខ្មែរko 한국어ku كوردی‎ky Кыргызчаlo ພາສາລາວla Latinlv Latviešu valodalt Lietuvių kalbalb Lëtzebuergeschmk Македонски јазикmg Malagasyms Bahasa Melayuml മലയാളംmt Maltesemi Te Reo Māorimr मराठीmn Монголmy ဗမာစာne नेपालीno Norsk bokmålps پښتوfa فارسیpl Polskipt Portuguêspa ਪੰਜਾਬੀro Românăru Русскийsm Samoangd Gàidhligsr Српски језикst Sesothosn Shonasd سنڌيsi සිංහලsk Slovenčinasl Slovenščinaso Afsoomaalies Españolsu Basa Sundasw Kiswahilisv Svenskatg Тоҷикӣta தமிழ்te తెలుగుth ไทยtr Türkçeuk Українськаur اردوuz O‘zbekchavi Tiếng Việtcy Cymraegxh isiXhosayi יידישyo Yorùbázu Zulu