• Skip to main content
  • Skip to footer
  • Home

The May 13 Group

the next day for evaluation

  • Get Involved
  • Our Work
  • About Us
You are here: Home / Archives for allblogs / freshspectrum

freshspectrum

May 22 2024

Finding meaning in our work

I fell into the world of data visualization in 2008, when an executive at the non-profit I was working for at the time decided to send a few of the younger staff members to a local talk by Edward Tufte.

My colleagues were mostly underwhelmed, but I came away changed (and with his 4 books that were included with the ticket price). I can’t remember the talk, and I would not say that I’m a Tufte superfan now, or that I even was at the time. But before that moment, I just hadn’t given much thought to the more creative side of my data work.

The ideas brought me back to my childhood, when I was just a kid who liked to draw and was good at math. And the talk re-ignited my creative spark that had been lying dormant for years.

Finding purpose.

Before putting together the data storytelling workshop I’ll be delivering next week I asked a bunch of questions to some of the folk who showed interest. While the answers were varied and helpful, this particular response stuck.

How would learning about it help my career? I don’t know that either, but I’m experiencing pretty severe burnout right now and trying to find my way out of it by making shifts in my work that keep it interesting for me and useful for the people I work with, and this has potential to do that.

If you have been following my work for a little while, you may already know that I often find myself flirting with burnout. In the past year I have been diagnosed with ADHD, which was more of a confirmation than a discovery. My mind just likes to go in a million directions, some helpful, some not.

And when things start to get a little too overwhelming, I just need to take a step back and lean into purpose.

My mission.

In a nutshell I believe my job is to help program evaluators, data analysts, and researchers unlock their creative potential. And eventually, to become confident data designers.

I was thinking of this mission when going through a workbook activity shared within my entrepreneurship community. Especially when this question popped up.

When in your life, or in the lives of others you love, has the lack of this mission caused substantial pain or discomfort.

(Note: I’m part of SPI Pro, and this was shared by Pamela Slim who is one of our entrepreneurs in residence. Here is my affiliate link if you’re interested in applying.)

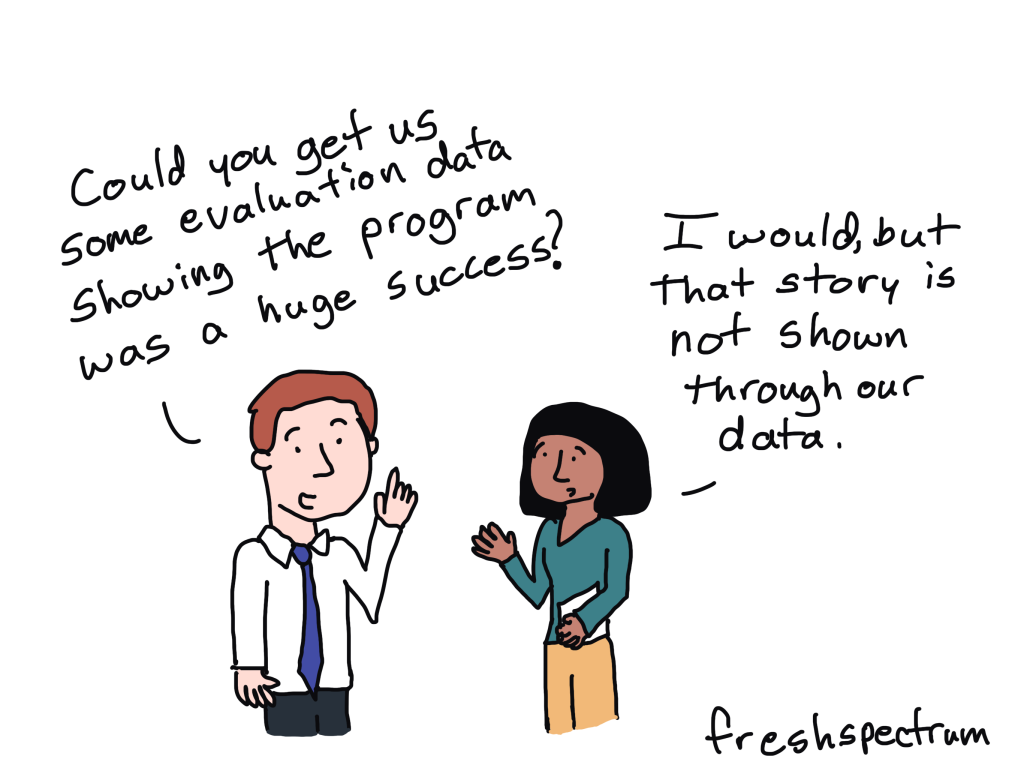
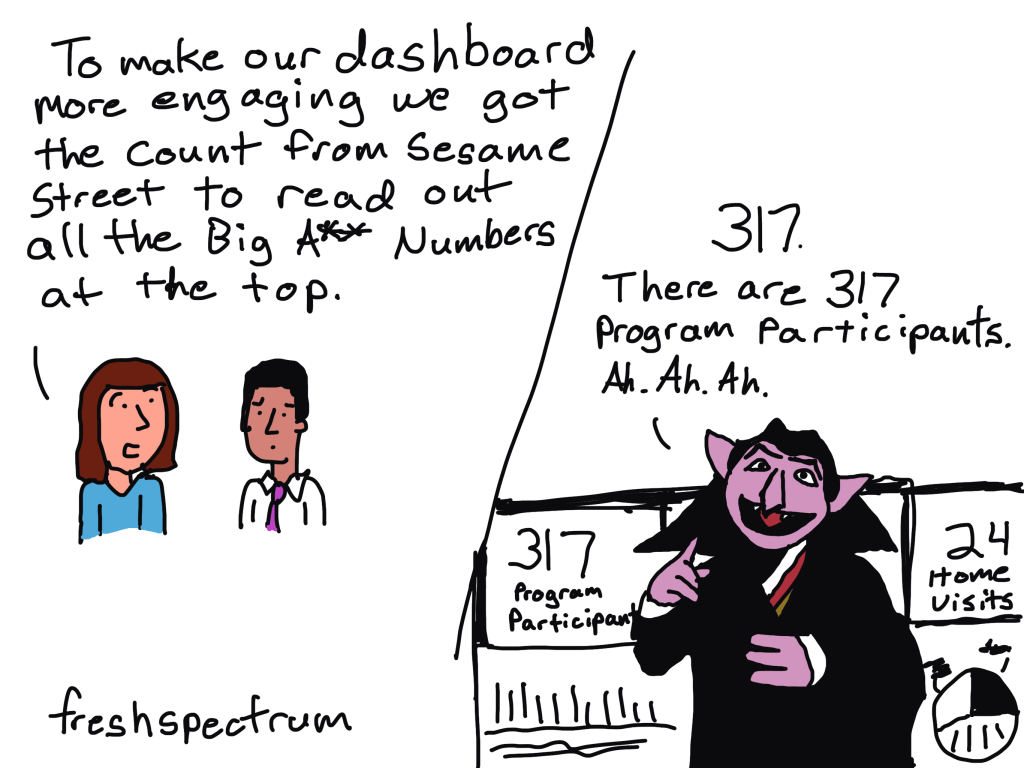
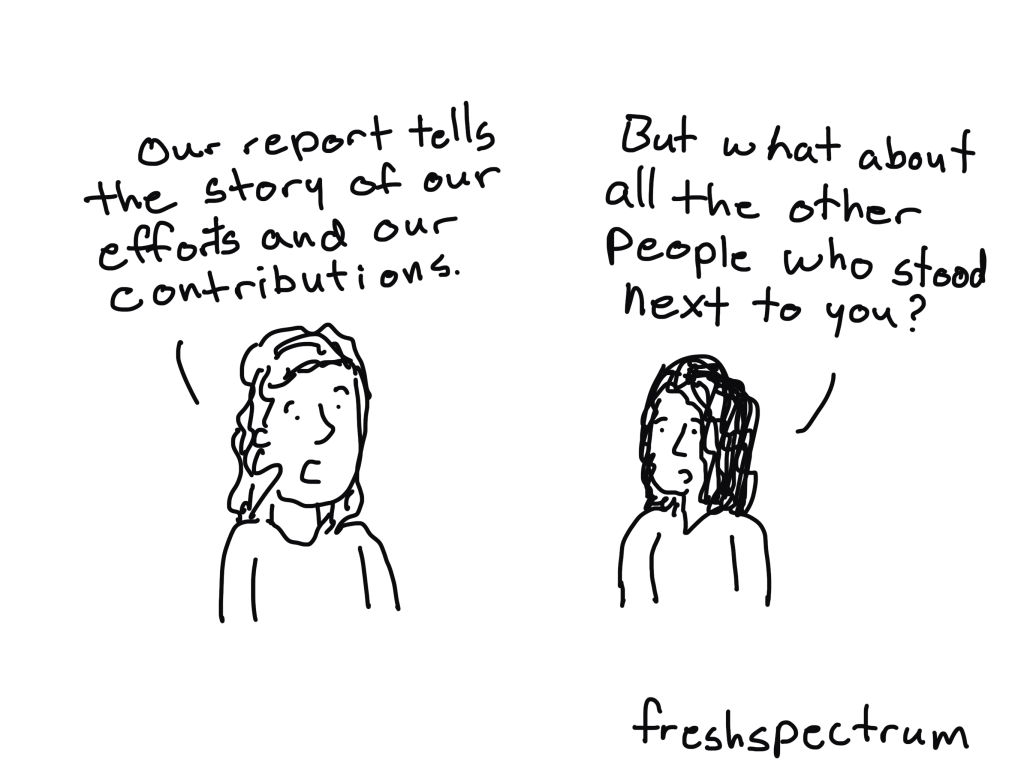
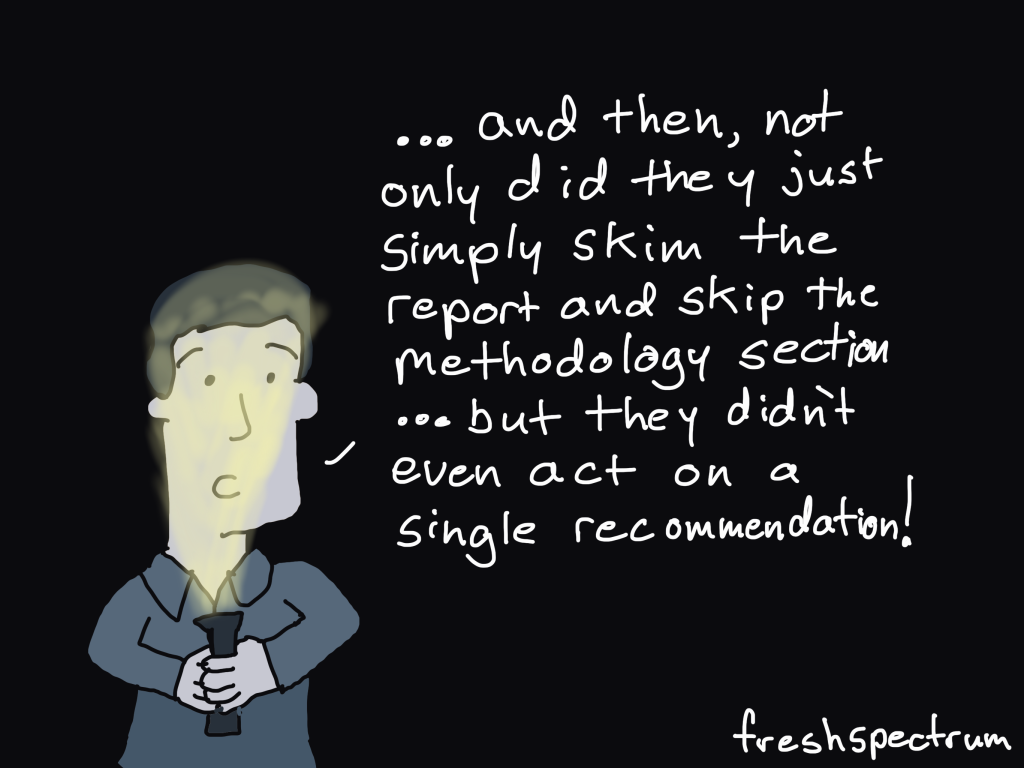
I believe in my own life, the times that I have been most frustrated with my job were when I had little control over the outcome of my work. Especially when the status quo created situations where data was wasted.

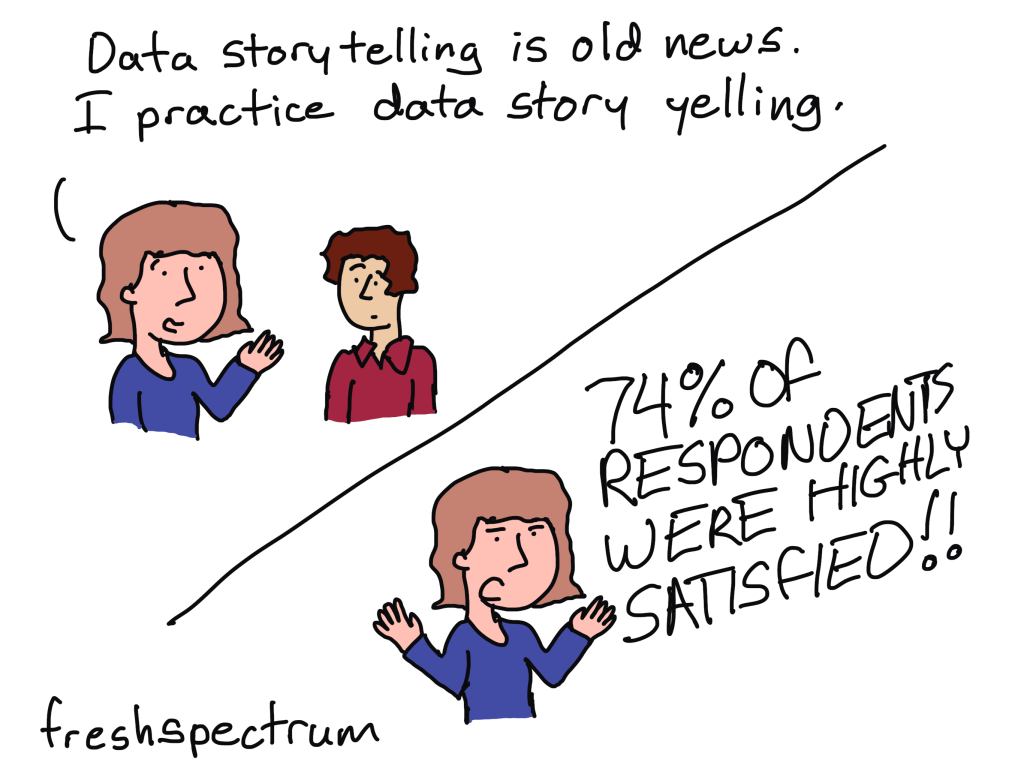
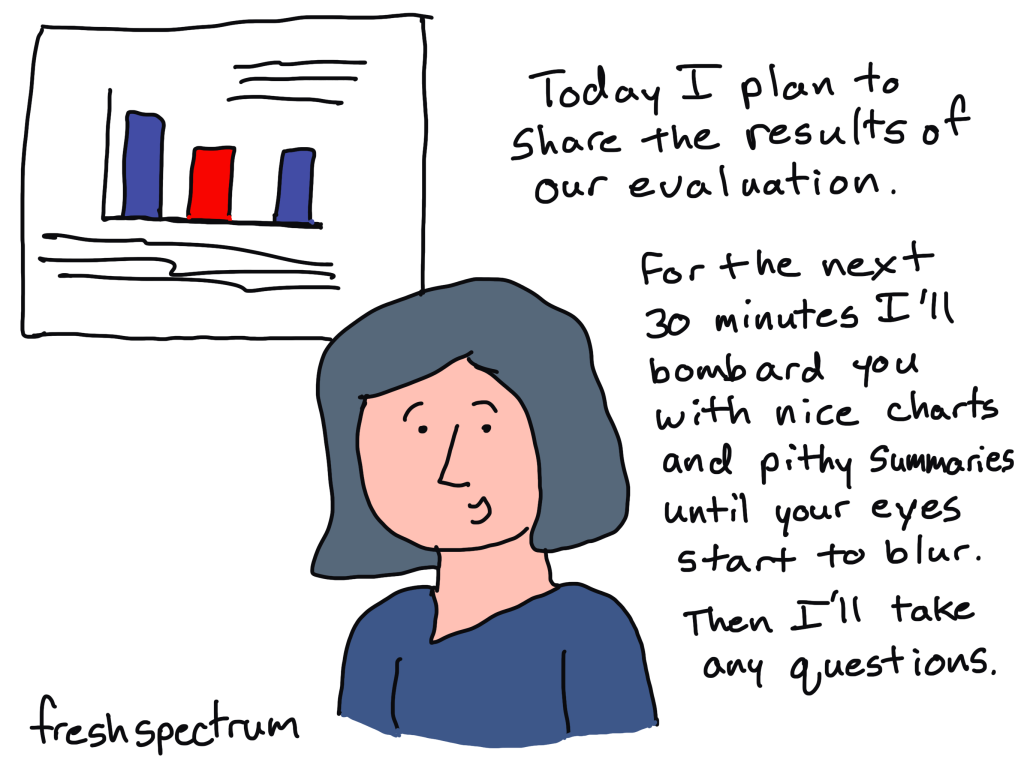
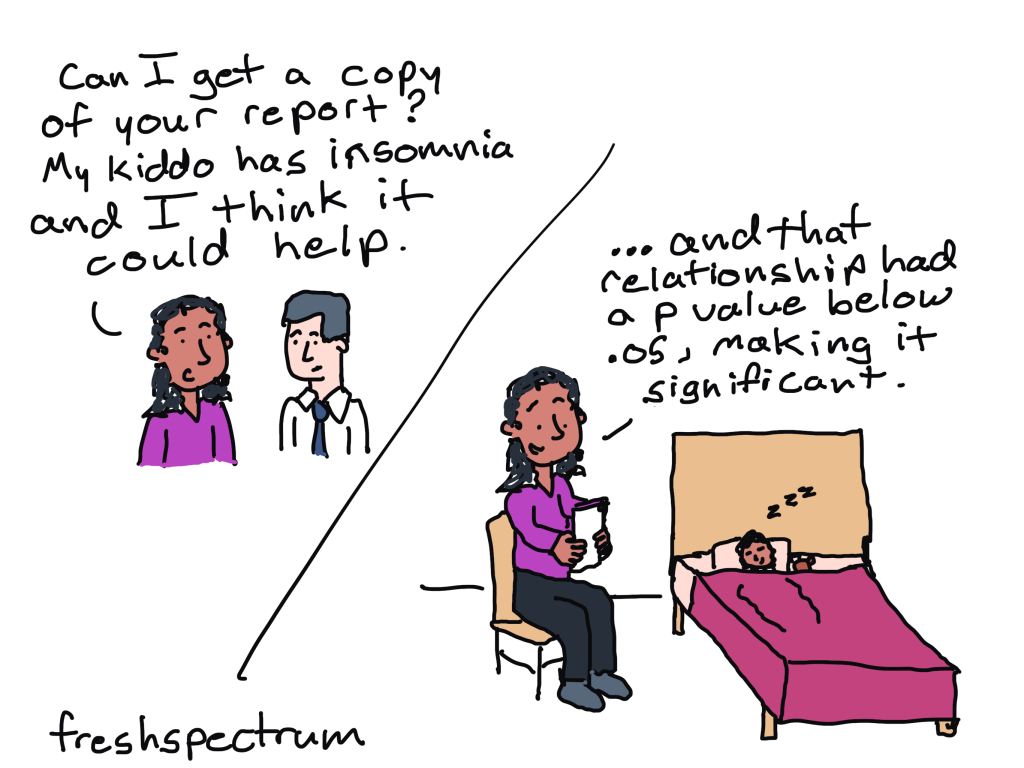
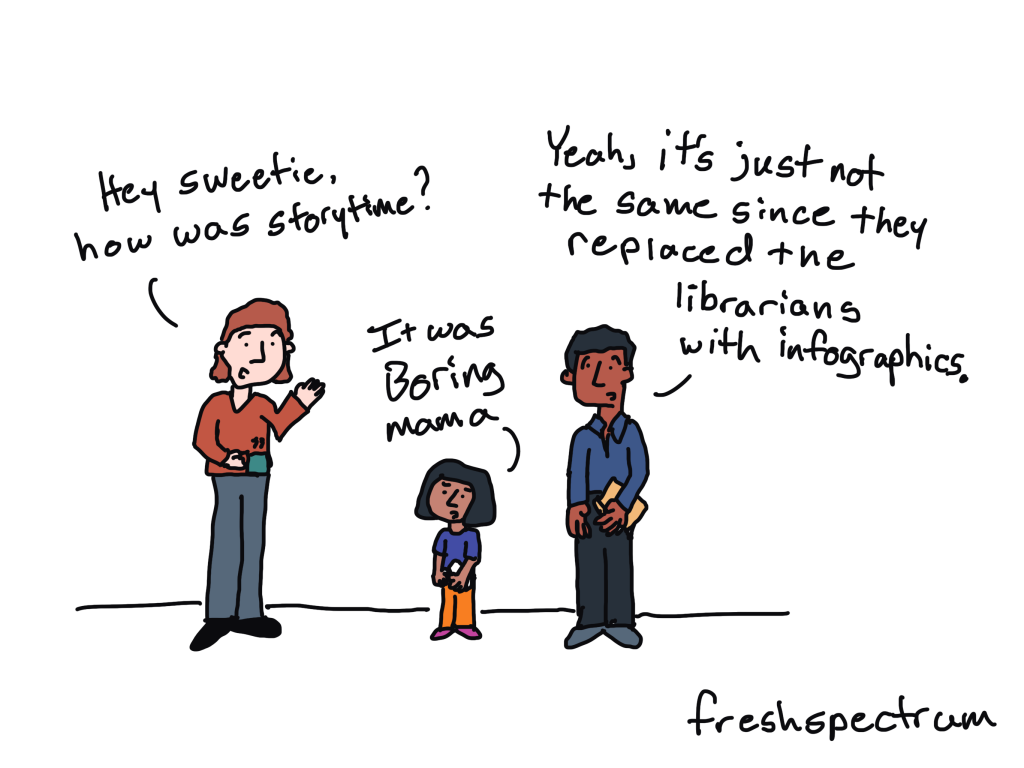
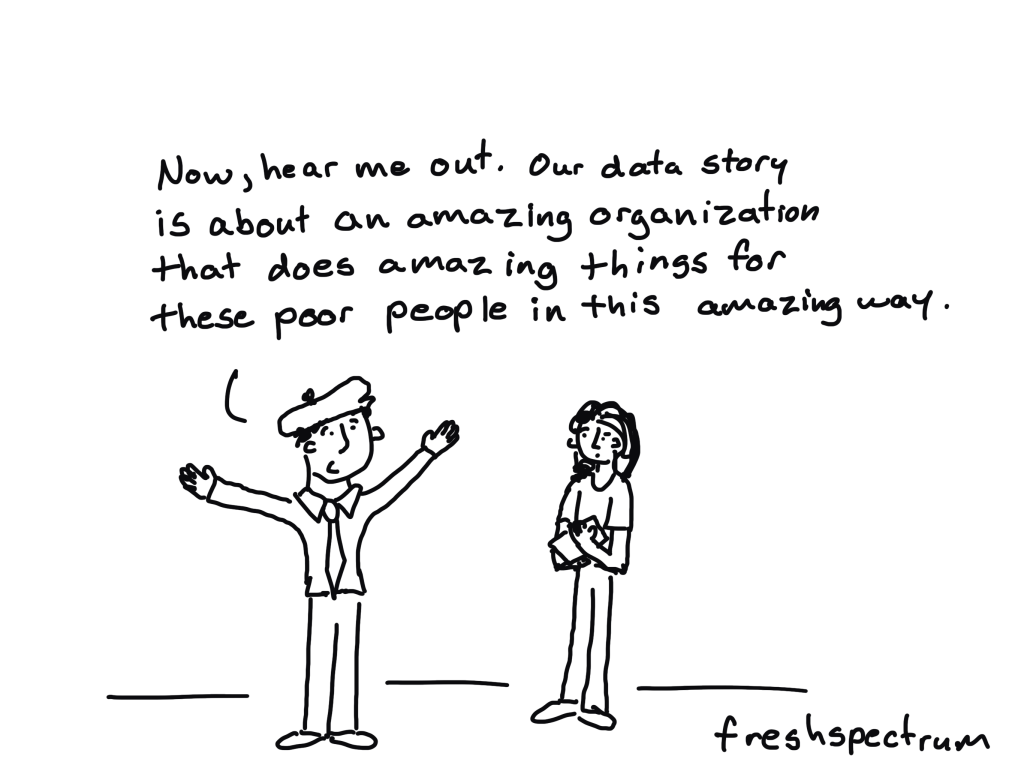
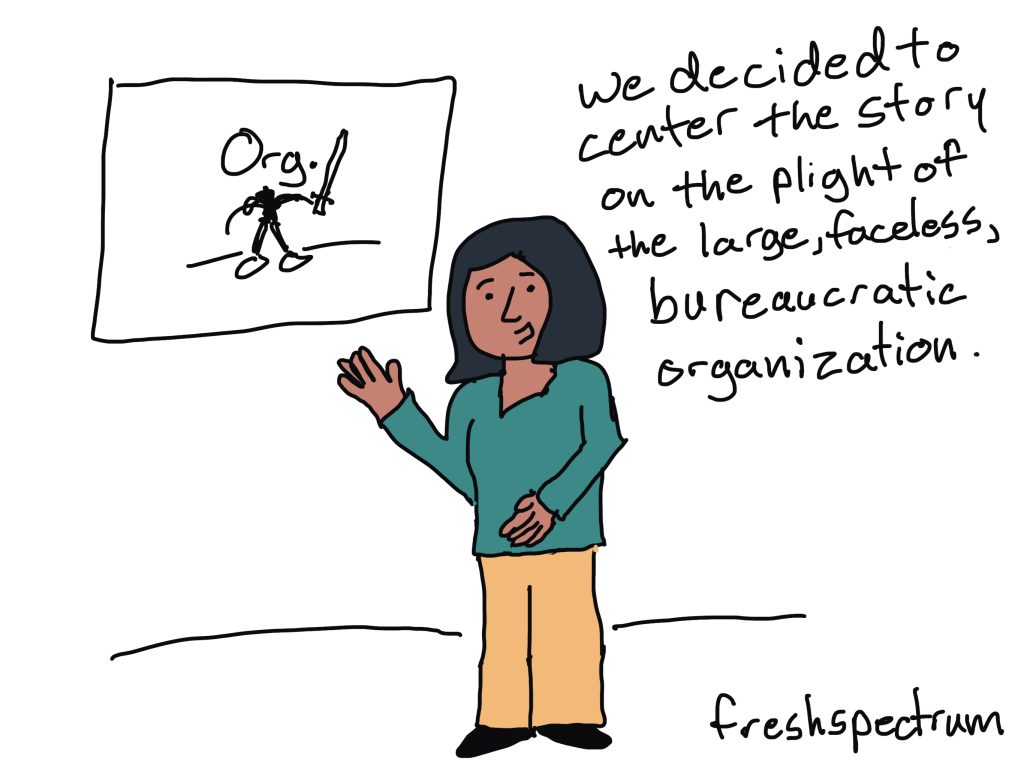
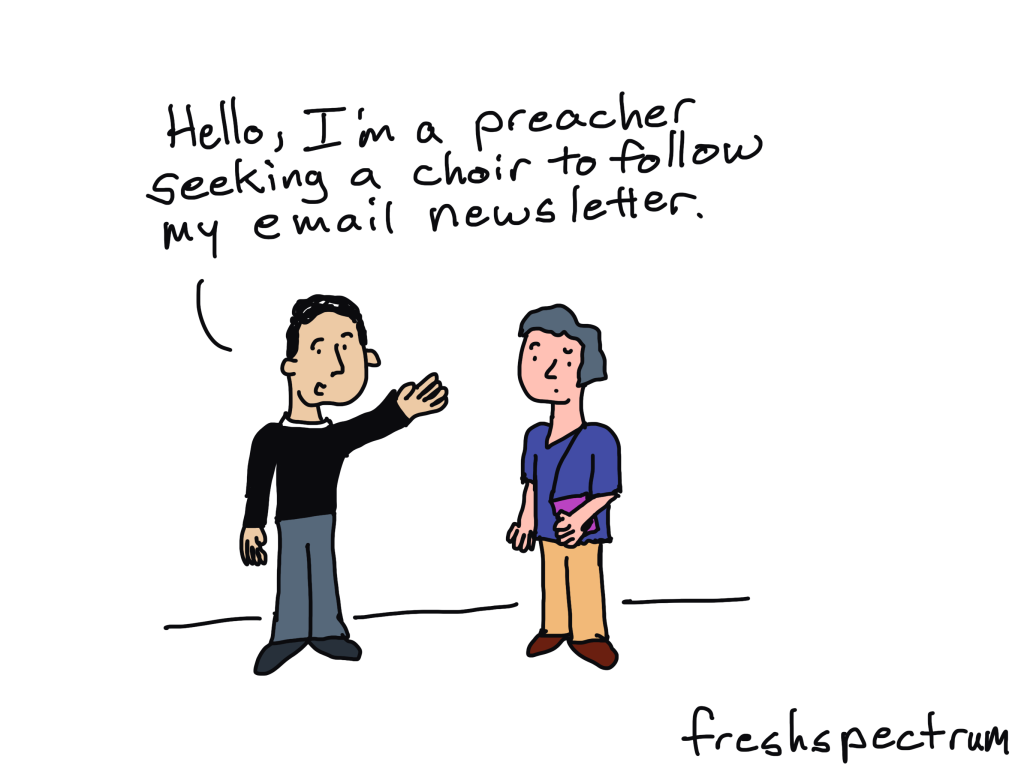
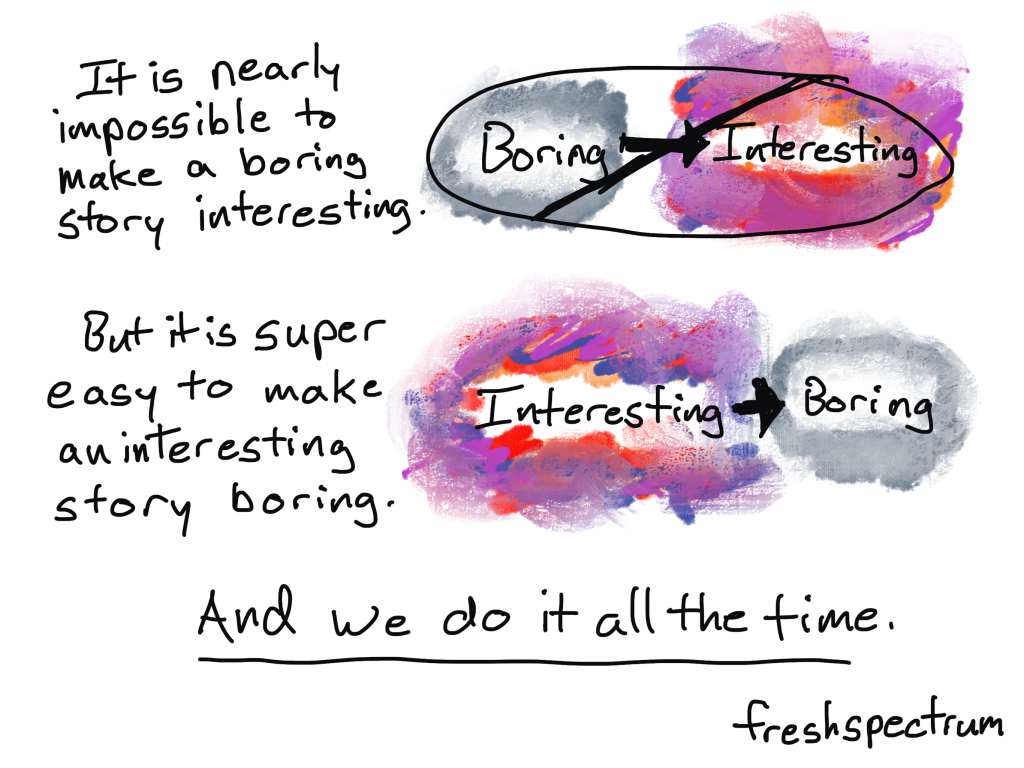
Those times when we spent thousands of hours finding interesting stories only to share them in the most boring way possible, and reaching the fewest potential audience members possible.

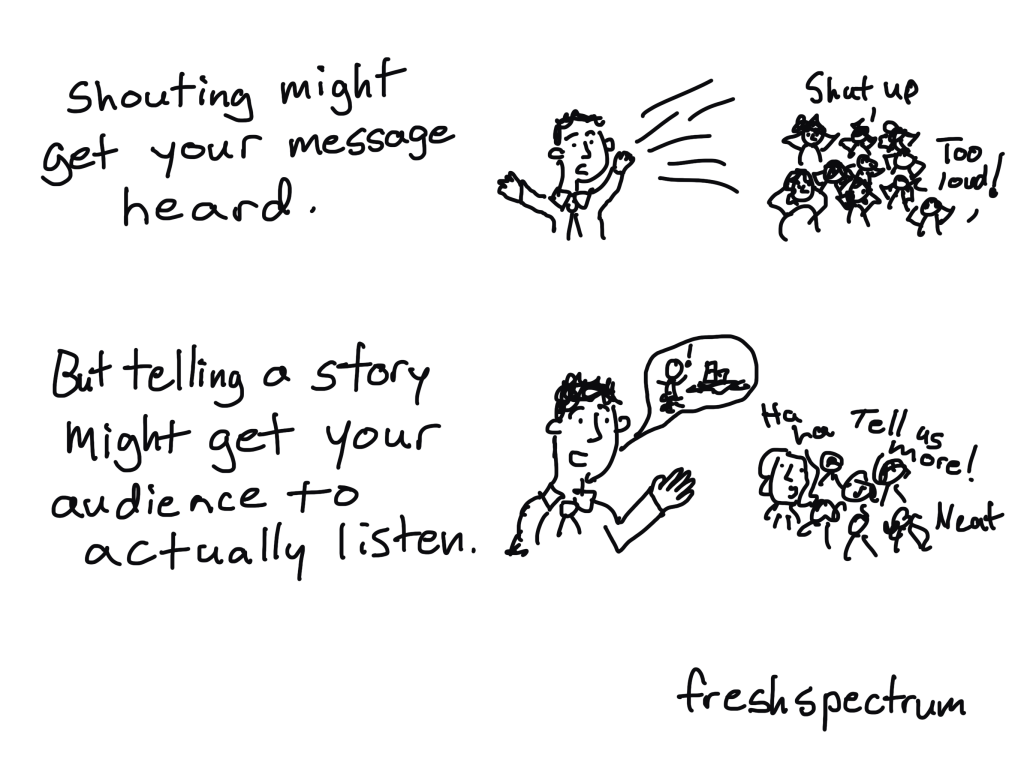
The solution I found was creativity. Learning data design gave me the tools I needed to bring practical change.

I believe that teaching practical creative skills to data folk gives them more power to challenge their own status quos. And helping them on the their journey to discovering this super power fulfills me more than any other thing that I do.

What is the meaning behind your own work?

I would love to know, leave me a comment if you’re up for sharing.

Written by cplysy · Categorized: freshspectrum

May 17 2024

Data Storytelling Comics

As I get ready to deliver my live data storytelling workshop (hint, hint), I decided to develop a series of comics. My goal over the next week is to create at least 20 (this post will grow as I go). Here’s what I have so far!

If you have any data storytelling inspiration for me or if any of these comics hit home, let me know in the comments!

Data Story Yelling

This one was inspired by a typo 🙂

Data Dump

What comes to mind when I say the words data storytelling?

“Making program evaluation plans and results available to people in ways that rivet them or, barring that, draw them into reflection without just bombarding them with nice graphs and pithy summaries.”

Inspired by a follower of this blog

Not our story

How do you think learning more about data storytelling will help you in your career?

“As the person who is behind the scenes on evaluation design, data collection, and management, I feel a great responsibility to do storytelling well because of how poorly things can transpire when a story is misleading or flat out biased.”

Another inspired by a follower of this blog

Shouting versus Storytelling

“Sometimes it seems like the push for more charts and storytelling is just saying the same things, louder. Or in bigger text on a slide.

Telling compelling data stories includes writing great headlines (often in big, readable text on slides!), but it also means thinking more critically around how you organize the information you’re presenting.”

Inspired by Amanda Makulec (who was responding to another of my data storytelling comics)

BANs (Big A** Numbers) and the Count

Sticking a bunch of big numbers at the top of an infographic or dashboard is like delivering the punchline of a joke without the setup.

Bedtime Data Storytelling

Does your data reporting style help with sleeplessness? Is that intentional?

Infographic Story Time

I was just thinking about how lame a library story time would be if you took away the people.

More to come (stay tuned)…

Now that you’ve seen the comics, join me for the workshop 🙂

You’ll learn:

  • Fundamental storytelling concepts, considerations, and tools.
  • A set of four different frameworks you can use to develop engaging data stories.
  • How to choose the right storytelling product to deliver your data story.
  • Strategies for illustrating your data stories.

Live May 28 & May 30 (10AM to 1130AM eastern each day)

Written by cplysy · Categorized: freshspectrum

May 07 2024

Events

On this page I’ll be listing all upcoming live events, along with the relevant registration or RSVP pages.

May 2024

5/14 & 516 – Workshop: Everyday Visual Reports [Register]

The next live session of my Everyday Visual Reports workshop is scheduled for Tuesday, May 14 & Thursday, May 16 starting at 3:00PM Eastern. The workshop is taught in two 90 minute sessions.

Registration is OPEN NOW.

5/23 – Webinar: Creativity Toolkit Mini-Session [Register]

The first mini-session on creating Icon Arrays & Pictograms will be held on Thursday, May 23 at 10:00AM Eastern. This 60 minute session is part of a series included with the purchase of any of my premium workshops. A separate mini-session only registration is also available.

Registration is OPEN NOW.

5/28 & 5/30 – Workshop: Effective Data Storytelling [Waitlist]

The first live session of my Effective Data Storytelling workshop is scheduled for Tuesday, May 28 & Thursday, May 30 starting at 10:00AM Eastern. The workshop is taught in two 90 minute sessions.

Registration will be opening soon. You can join the waitlist here.

Ongoing

5/8, 5/15, 5/22, 5/29 – Office Hours [RSVP]

Office Hours are held two times on Wednesdays at 10AM Eastern and 3PM Eastern. As long as at least one person RSVPs, I will hold the session. One year of office hours are included with every premium workshop enrollment (they stack if you enroll in more than one workshop).

You can also register separately. RSVP Here

Written by cplysy · Categorized: freshspectrum

Apr 24 2024

We are story finders.

When I started drawing comics, back in the early 2010s, there were these really popular animations put together by the Royalty Society of Arts (RSA) in London.

My comics have always been pretty simple in format. And early on, before I would even attempt to draw hands, they were even simpler. So often I would get this question about whether I would be able to create an RSA style video.

I definitely gave it a few tries. I created illustrated videos for a couple of book trailers and a few evaluation related projects (ex. What is Evaluation Impact, From Small to Big: How to Achieve Greater Impact). And while I have created a couple more in past years, for the most part I stopped.

I stopped animating partly because I don’t think I really have the skills or interest for the job. But I also kept running into a problem when discussing projects with potential clients. The problem is that you just can’t make a good video without a good story.

The big reason why RSA Animates were so popular.

RSA Animates took talks from brilliant presenters, and then added whiteboard illustration. By the time Ken Robinson’s RSA Animate was released, he had already delivered what is still one of the most popular TED talks of all time (Do Schools Kill Creativity?).

Was the animation good? Certainly. But the talk itself was great. You didn’t even need to watch the talk to find it compelling, you can just listen.

And that’s the thing about the RSA Animates. The animation is just the icing on the cake. If the presentation was lame, animation would not make it better. It would just be nice icing on a stale flavorless cake. But if you start with a good talk, you could then use animation to add value.

Data storytelling is no different.

Good storytelling requires good stories.

Before you can tell a good story, you need to find a good story.

Luckily, if you are reading this, you are probably a researcher, evaluator, or some other kind of data person. And story finding IS YOUR JOB.

  • When you try to understand how a program works, you are searching for the program’s story.
  • When you dive into a dataset looking for interesting survey findings, you are searching for interesting stories.
  • When you attempt to answer most research questions, you are still just searching for stories.

We use stories to make sense of information. Whether they are qualitative stories we collect directly from people or stories assembled from sets of quantitative data, these stories give us a sense of how things work.

Unfortunately, these stories are not always interesting or worth sharing. You have to use your understanding of your audience to decide which of the stories you find are worth telling.

Just don’t be a story hoarder.

Researchers and evaluators are not the press. Telling the story publicly is not always the point of a funded project. But that doesn’t mean you just hold onto the stories you discover.

As a story finder I believe that you have a responsibility to tell the good stories.

Because if you don’t, who will?

Written by cplysy · Categorized: freshspectrum

Apr 17 2024

Who is the Hero? Storytelling Methods for Data People.

Good stories always have heroes, even data stories. So who is the hero in your story?

So technically, a story is just a sequence of events. And you can layout a sequence of events without the use of characters. But thinking of your stories, and telling them, through the eyes of characters (especially a good protagonist) can really elevate the quality.

So how do you do that with data stories? That’s what we’ll discuss in today’s post.

For a little extra context, a couple of weeks ago I put out a course waitlist wondering what my readers really wanted to learn related to data design. And out of all the topics I listed, data storytelling rose to the top. So as I dive down the rabbit hole that is storytelling, preparing for a course to be launched (perhaps in May?), I thought I would share some basic methods here on the blog.

The Hero’s Journey and Us

The hero’s journey is a really common story template that has been adapted to meet all sorts of needs from literature to script writing to business planning. We won’t dive in too deep at this moment, but it does give us a good starting point for talking about the hero (a.k.a. our main protagonist).

Out of all the various character archetypes you could include in a story, a hero is almost certainly the most important.

But who is the hero in a story about a program’s performance? Is it the program? Is it the board or leadership? Is it a member of the program staff? Is it a funding recipient? Is it the ultimate beneficiary?

Honestly, you can center any of these as the hero of your stories. But some points of view will definitely give you more compelling stories than others.

Centering the Organization as the Hero [Don’t Do This]

For some reason I feel like this has become the default. Which is unfortunate.

Organization heroes make for pretty dull stories.

Let’s look at how the Department of Education’s Institute of Education Sciences centers itself in its web page copy and reports. Here is an example from the web page.

IES Home Page Image Screenshot

Driving Innovation through Research. IES invests in high-quality research that sparks innovative solutions to real-world challenges in education.

Who is the hero? Clearly it’s IES that’s doing the investing that is leading to innovation.

This kind of language gets continued on the “About Us” page. Look at the number of sentences that start with we.

IES About Page Screenshot

Okay, now let’s dive into their latest Biennial Report to Congress.

IES Report Screenshot

IES is a leader throughout the world in advocating for-and achieving-advances in rigorous applied and basic education research and development. This biennial report is an opportunity to highlight some of the accomplishments of the Institute as well as highlight the foundation that has been built to propel IES into the future.

Who is the hero? Clearly it’s the Institute.

This kind of centering becomes a habit that starts from the top and then permeates through an entire organization. It’s one of those “mindless centering of self” kind of things that we all tend to do.

Centering Beneficiaries and Direct Service Providers as Heroes [Consider This]

UNICEF offers us an alternative example in how to think about organizational storytelling.

Here is the current top of the “What we do” page.

UNICEF What We Do Page Screenshot

While the language does do some centering of the organization it quickly switches perspective. The text adds a new character, “children.”

By saying “Every child has the right to grow up in a safe and inclusive environment,” the child becomes the central figure (which then gets repeated throughout the page). UNICEF becomes the mentor, or guide, that supports the child’s journey.

Who is the hero? On the about page, I would suggest the hero is the child.

Perhaps you might think that’s a stretch. So let’s take a dive into one of UNICEF’s flagship reports. The State of the World’s Children 2023.

The first few stories center children.

UNICEF Child Story Screenshot

In Yemen, 7-year-old Hind has grown up in a country where health services have been deeply affected by conflict. But a team of committed health workers, whose mission it is to protect their community, reach children like her with life-saving vaccines.

UNICEF Child Story Screenshot

In Pakistan, 4-year-old Iman received her polio vaccine. Her grandmother was initially hesitant to get her immunized. But thanks to the dedication of a health worker, who helped the family access health services, trust was built and Iman was vaccinated.

Who is the hero? The Children.

These are stories that show each child’s journey towards getting vaccinated. Health workers are heroic figures that appear in these specific stories, but not as the central figure.

This approach changes as the report goes on (there are many stories included in this report). We move from centering children to centering health workers. And it becomes clear that the organization is not centering itself in any of these stories, we can only assume that they had some role in the background.

UNICEF Healthcare Worker Screenshot

Marìa Ortencia Catucuago is a community health worker in Ecuador. She cares for the indigenous Turucucho community, nestled in the foothills of the north-eastern highlands. In addition to her work engaging the community on the importance of vaccines, she tends to a dairy farm and delivers milk. “I feel passionate about helping others,” she says. “I want all the children in my community to grow up healthy, happy and with the same opportunities.”

UNICEF Healthcare Worker Screenshot

For Ghada Ali Obaid, vaccinating children is not a job. It’s a calling. She dashes through the Dar Sa’ad Medical Compound in Yemen, counselling mothers about the benefits of immunization and takes to the road to reach children who might otherwise miss out. Ghada’s husband, Ehab, takes time off from his job as a taxi driver to bring her to more remote areas. “I encourage her to show up every day because she is so passionate, and she has my full respect,” Ehab says.

Who is the Hero? The Health Workers

How will you apply this lesson to your own reporting stories?

Who do you center when you write a report?

How often do you treat an organization as if it were a person? Would it be better to center individual project staff members in some of your stories? Could you center some of the program’s direct beneficiaries?

Written by cplysy · Categorized: freshspectrum

  • « Go to Previous Page
  • Go to page 1
  • Interim pages omitted …
  • Go to page 8
  • Go to page 9
  • Go to page 10
  • Go to page 11
  • Go to page 12
  • Interim pages omitted …
  • Go to page 54
  • Go to Next Page »

Footer

Follow our Work

The easiest way to stay connected to our work is to join our newsletter. You’ll get updates on projects, learn about new events, and hear stories from those evaluators whom the field continues to actively exclude and erase.

Get Updates

Want to take further action or join a pod? Click here to learn more.

Copyright © 2026 · The May 13 Group · Log in

en English
af Afrikaanssq Shqipam አማርኛar العربيةhy Հայերենaz Azərbaycan dilieu Euskarabe Беларуская моваbn বাংলাbs Bosanskibg Българскиca Catalàceb Cebuanony Chichewazh-CN 简体中文zh-TW 繁體中文co Corsuhr Hrvatskics Čeština‎da Dansknl Nederlandsen Englisheo Esperantoet Eestitl Filipinofi Suomifr Françaisfy Fryskgl Galegoka ქართულიde Deutschel Ελληνικάgu ગુજરાતીht Kreyol ayisyenha Harshen Hausahaw Ōlelo Hawaiʻiiw עִבְרִיתhi हिन्दीhmn Hmonghu Magyaris Íslenskaig Igboid Bahasa Indonesiaga Gaeilgeit Italianoja 日本語jw Basa Jawakn ಕನ್ನಡkk Қазақ тіліkm ភាសាខ្មែរko 한국어ku كوردی‎ky Кыргызчаlo ພາສາລາວla Latinlv Latviešu valodalt Lietuvių kalbalb Lëtzebuergeschmk Македонски јазикmg Malagasyms Bahasa Melayuml മലയാളംmt Maltesemi Te Reo Māorimr मराठीmn Монголmy ဗမာစာne नेपालीno Norsk bokmålps پښتوfa فارسیpl Polskipt Portuguêspa ਪੰਜਾਬੀro Românăru Русскийsm Samoangd Gàidhligsr Српски језикst Sesothosn Shonasd سنڌيsi සිංහලsk Slovenčinasl Slovenščinaso Afsoomaalies Españolsu Basa Sundasw Kiswahilisv Svenskatg Тоҷикӣta தமிழ்te తెలుగుth ไทยtr Türkçeuk Українськаur اردوuz O‘zbekchavi Tiếng Việtcy Cymraegxh isiXhosayi יידישyo Yorùbázu Zulu