• Skip to main content
  • Skip to footer
  • Home

The May 13 Group

the next day for evaluation

  • Get Involved
  • Our Work
  • About Us
You are here: Home / Archives for allblogs / freshspectrum

freshspectrum

Mar 06 2024

Canva Templates – Inspired by the Nature Conservancy

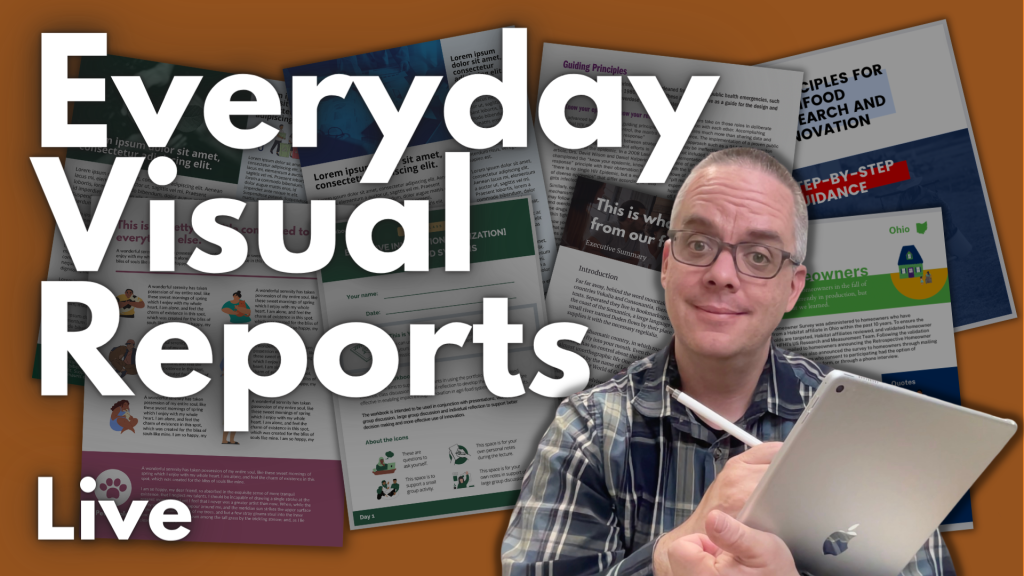
Trying out a new series this week. The idea is simple, I find some inspiration and then use that inspiration to create a set of Canva report page templates.

If you keep your eyes open, design inspiration is literally everywhere. Mailers, posters, text books, magazines, websites, and social media are just a handful of potential inspiration sources.

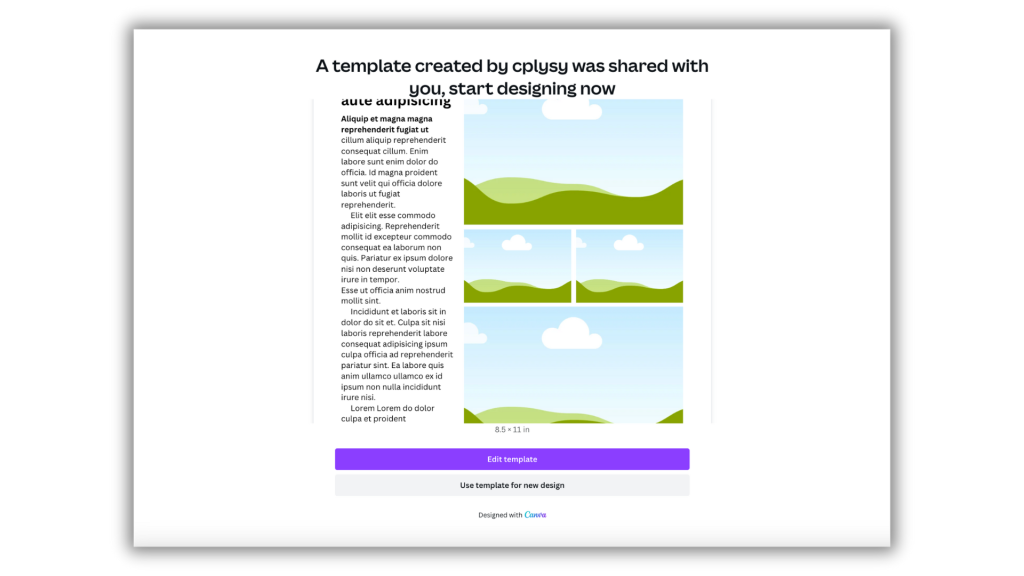
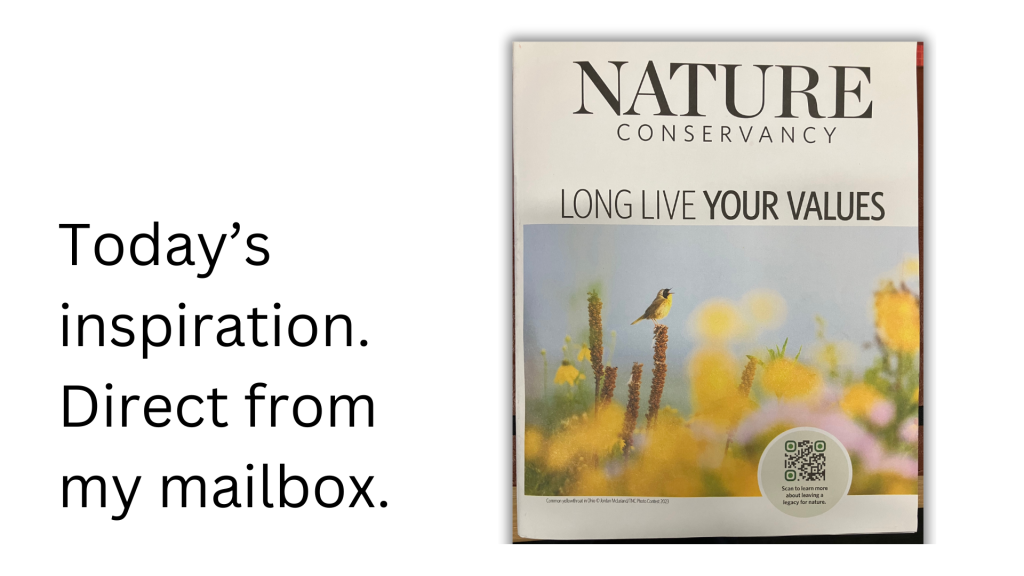
This week’s inspiration comes from one of those little “magazines” that shows up in your mailbox after giving to a charity. This one is from the Nature Conservancy. Let’s dig in and see what we can find. You’ll find the Canva template link for all of these at the bottom of the post.

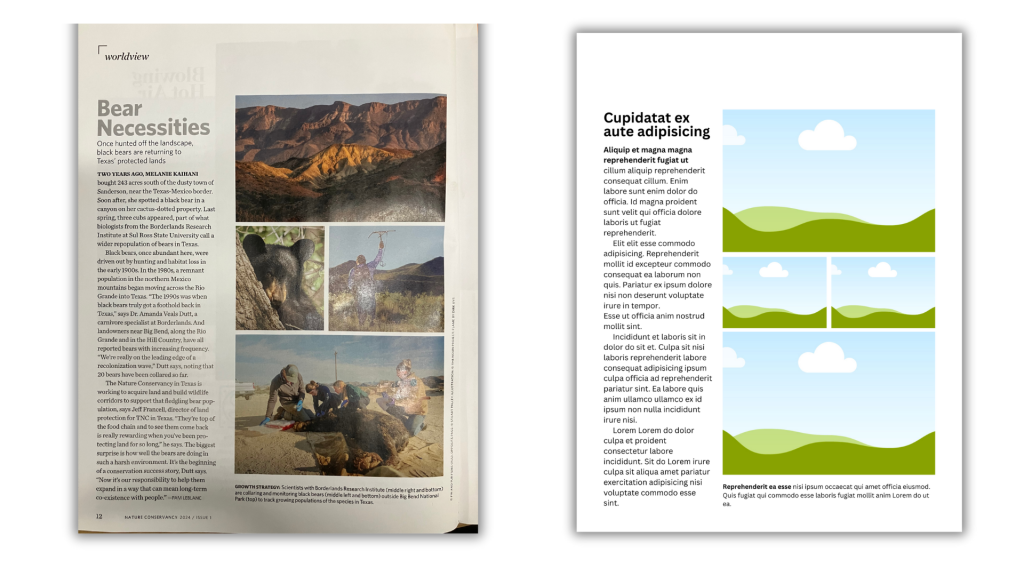
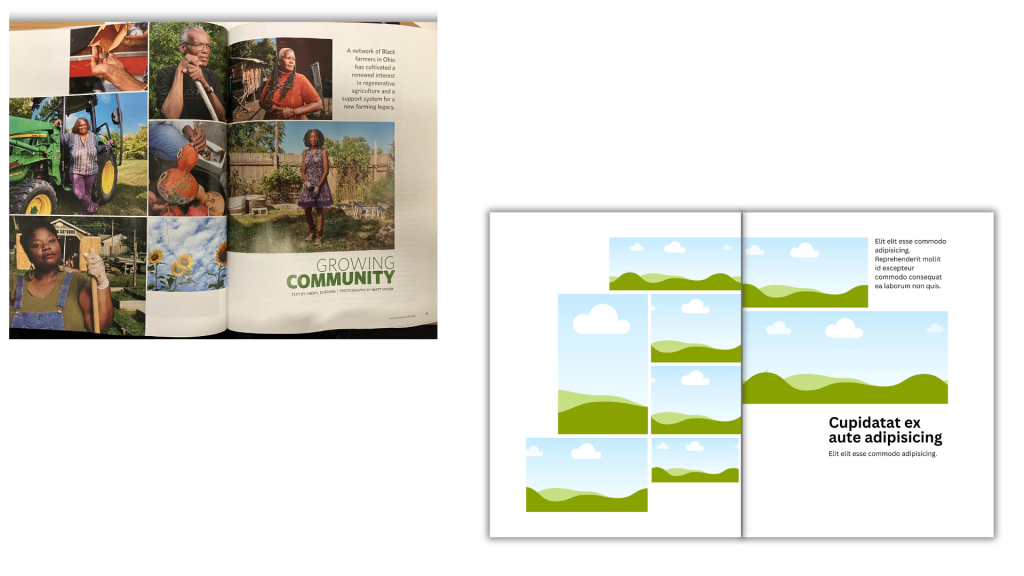
Sidebar with multi-photo spread.

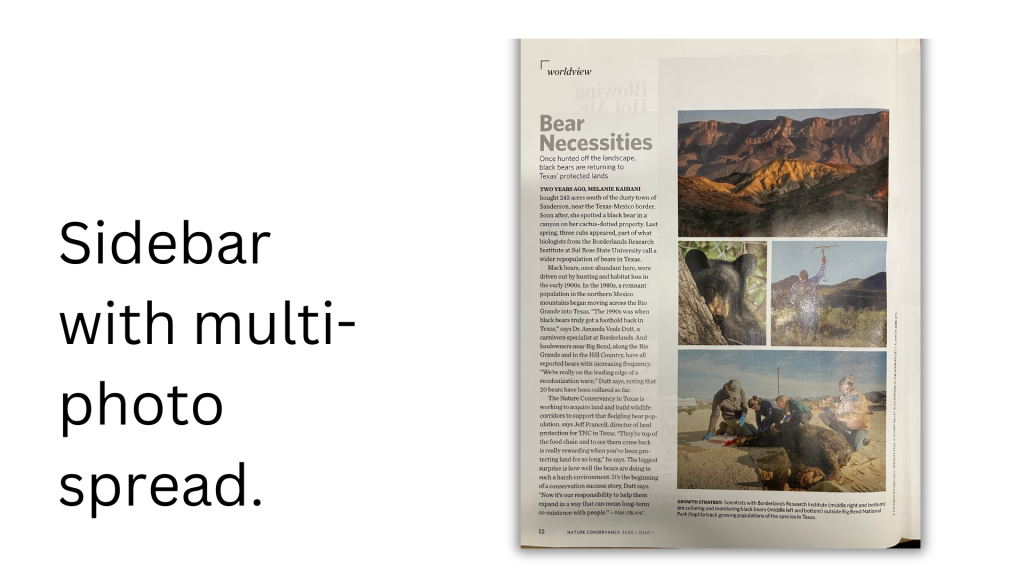
This spread is something you see in magazines all the time. The written article is only given a sidebar, the rest of the page is made of up a photo grid.

Yes, words are important. But the more important the words, the less space you should give them on a page. Because it’s going to make it that much more likely someone will actually read those words.

Another cool thing about this kind of spread is that you can use anything in those visual spots. Want to share a collection of charts instead of photos, go for it.

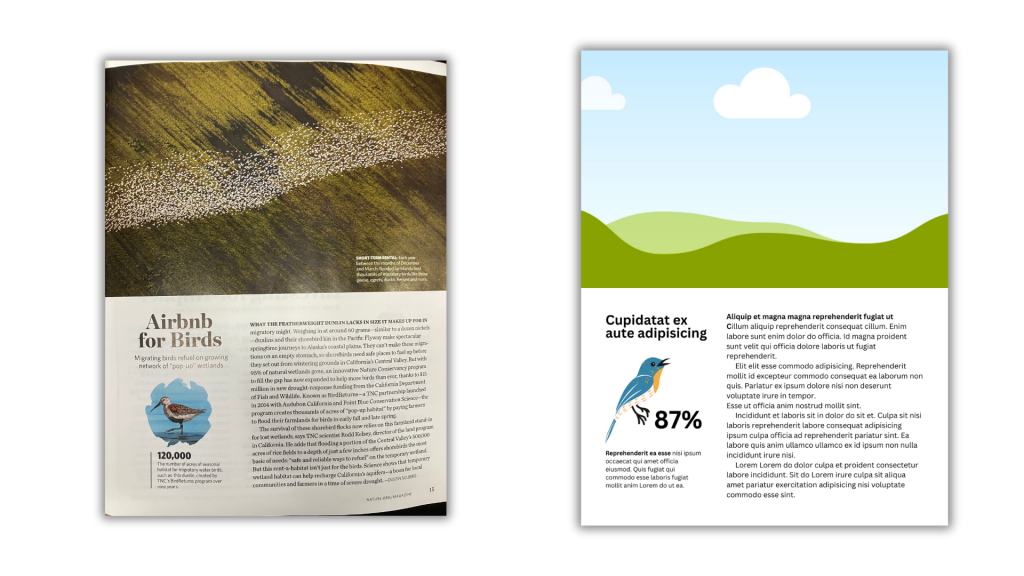
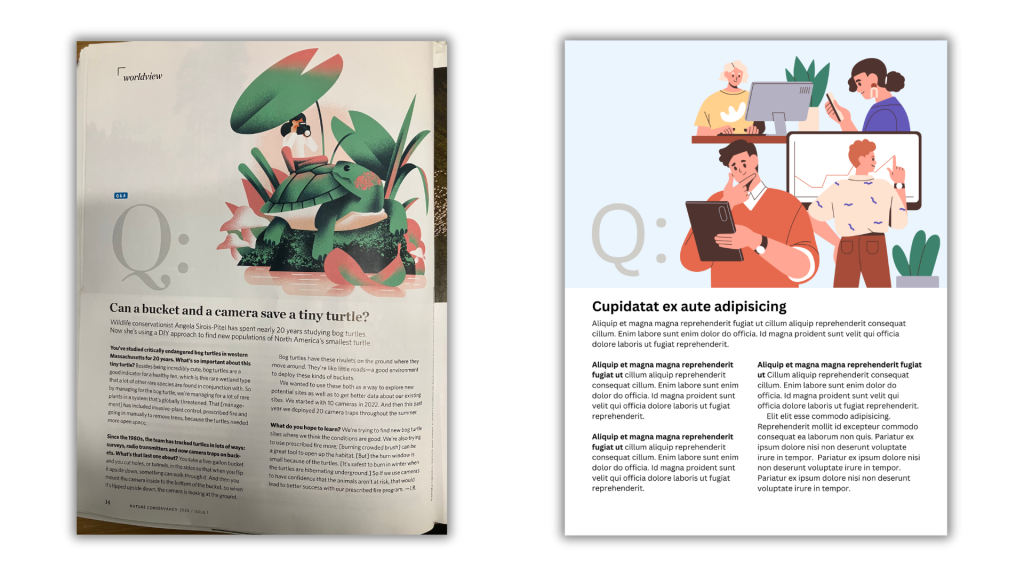
The little infographics spread.

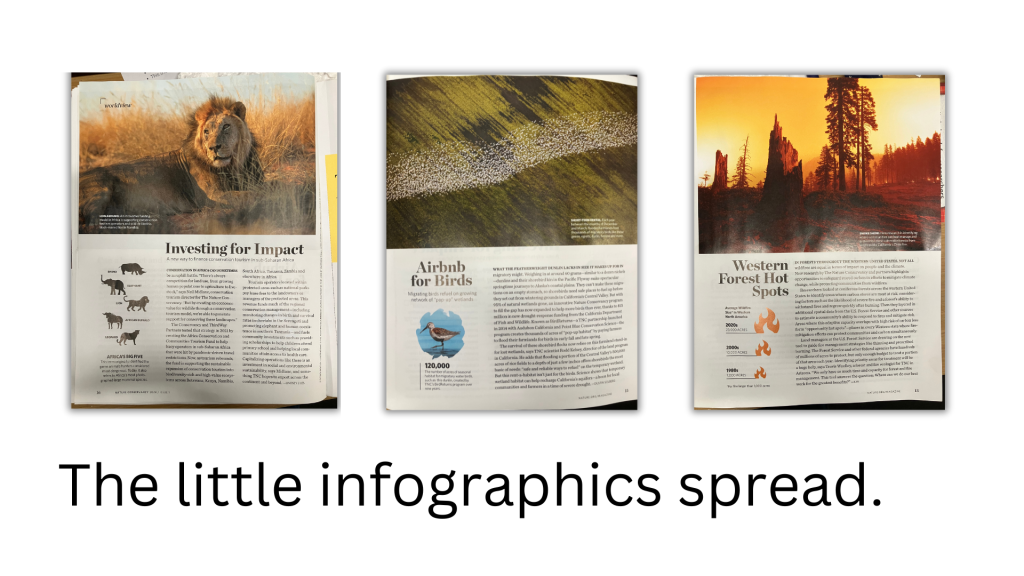
I saw this spread being used multiple times in the magazine. Basically, you have a big photo taking up the top half of the page. The bottom half right 2/3 is an article. The bottom half left 1/3 is a little miniature infographic.

This would be a great opportunity for a sound byte style data point or simple chart. The big picture at the top draws you in, the infographic delivers a point, and the article expands upon the point.

Big Q little a.

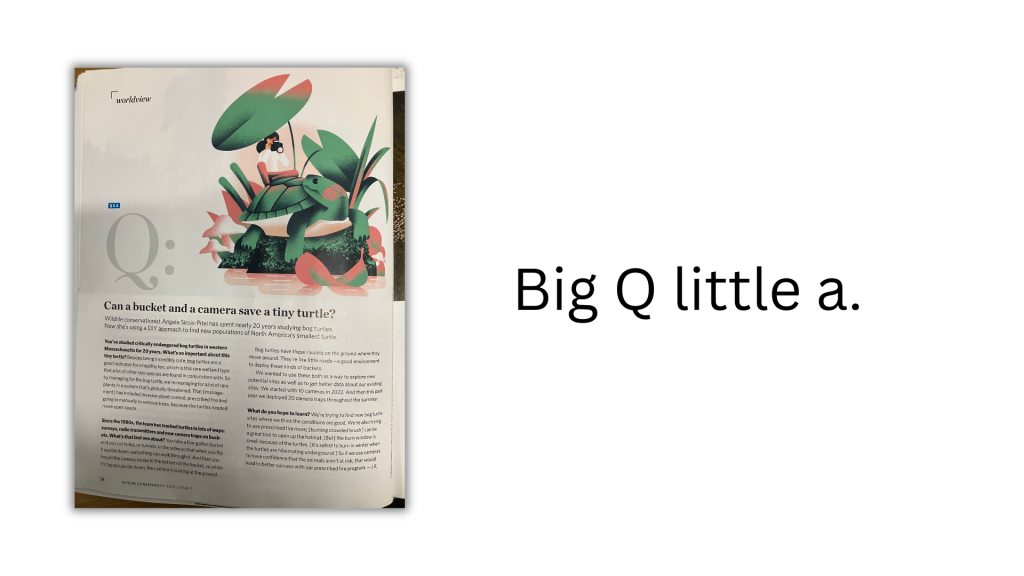
Q&A posts are standard fare for so many magazines.

This spread continues the trend of only using half the page for written content. The big Q at the top let’s you know it’s a Q&A post.

I think this kind of thing would work really well in many reports. Find a stakeholder (partner, participant, program staff member, etc.) and do a quick Q&A. Not only would this split up the narrative in a logical way, it’s also a nice way to incorporate other voices into your reporting.

People Stories.

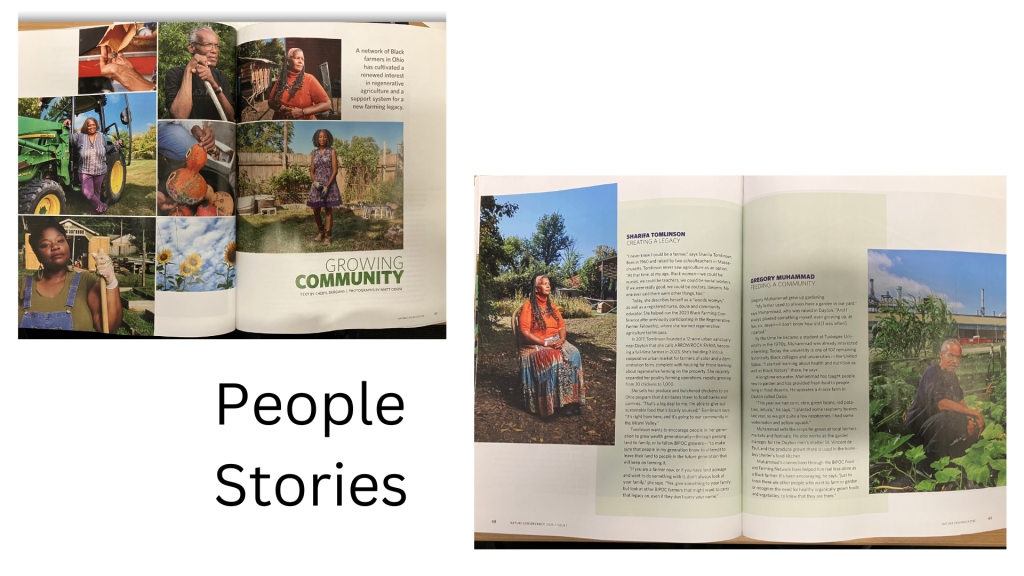
When you can do it, having actual pictures of interviewees is a really nice way to bring a human element into your reporting. A lot of qualitative reporting tends to fall into summary style with lots of quotes and arranged by topic or code.

But simply giving space for each participant’s individual story is a super easy way to go. Then you can bring all the pictures together at the beginning of the story as a collage to set the scene.
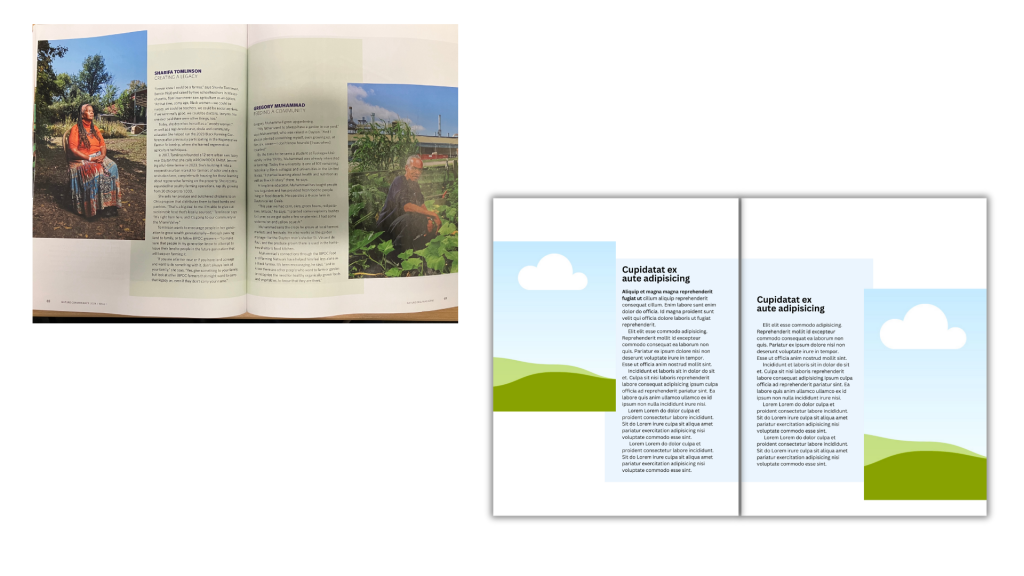
Timeline graphic

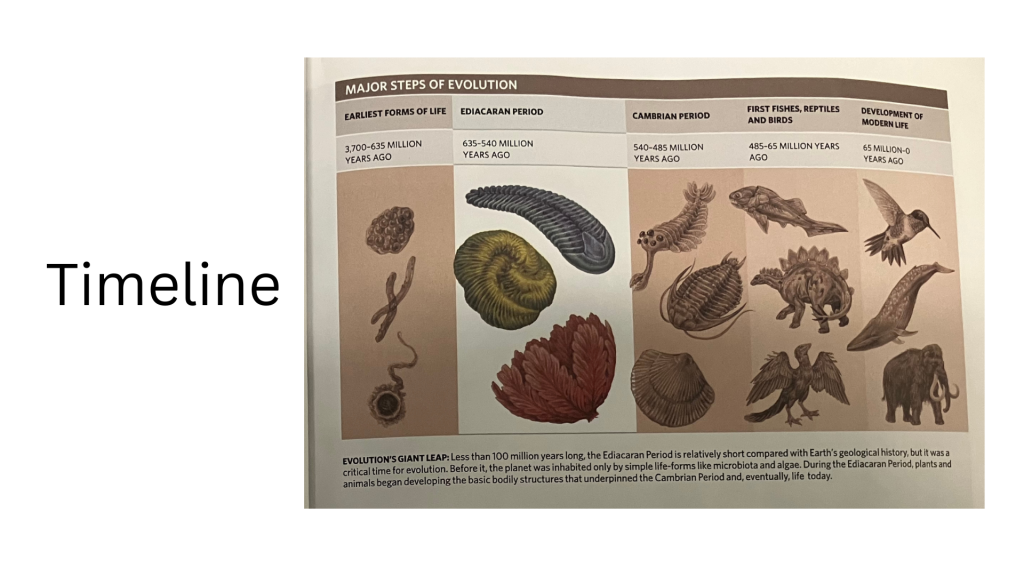
I like how this timeline was laid out. It’s really simple, the step that is the focus of article gets white background with color objects in the foreground. Everything else gets muted backgrounds and sepia tones. The focus section in the example also gets a little bit more landscape than others, and since it’s evolution there is even a little overlap of pictures between phases.

There are all sorts of places for simple timelines in most reports. Especially when a project has particular phases.

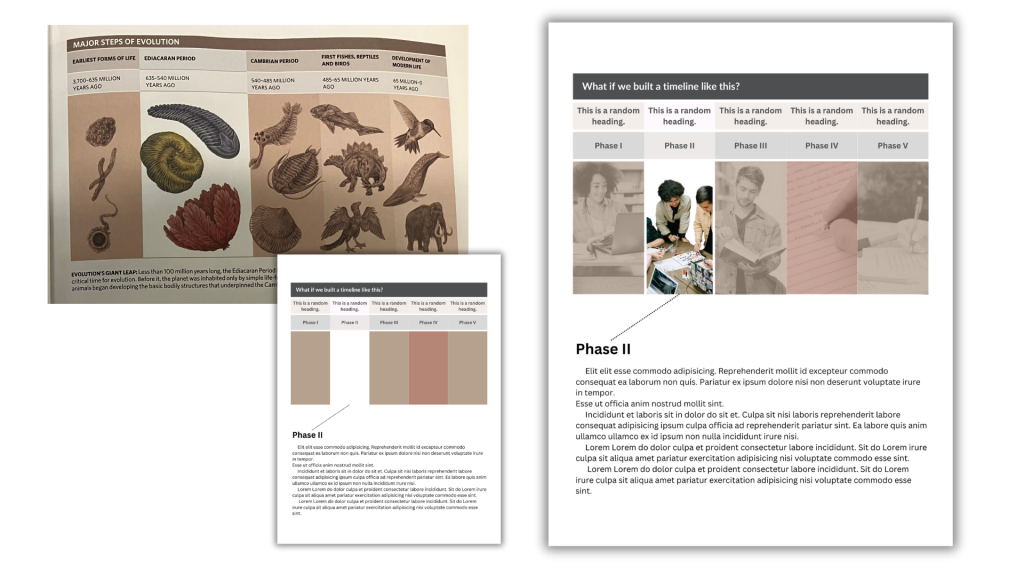
In my template I decided to black and white the pics and make them a little transparent to pull in some background color blocks. I also removed the background on the phase I want to highlight. If this were a real report, you could have a page for each individual phase, doing the same treatment isolating each block.

Want the Canva templates?

I stopped worrying about whether I was using pro stock or not. I’m a pro user but you can make any template free by just replacing premium content with free elements or uploaded content. For most of the individual pages it will be an easy switch out.

Also, make sure you sign into your Canva account BEFORE clicking the template link.

Written by cplysy · Categorized: freshspectrum

Feb 27 2024

Evaluation Ethics Fails, 7 illustrations

I’m sick this week, so instead of writing something new, I thought I republish something valuable from 11 years ago. This cartoon was inspired through a conversation with my good friend Ann K. Emery.

This was back when Ann was a full time evaluator and before the launch of her super successful training academy and professional development business Depict Data Studio [affiliate link].

All of the comics shared in this post are based on true stories…which is probably why they hold up so well!

Low Response Rate

Evaluator: “Here are the survey results for your program. The results suggest that _____, but here’s a caveat – there was a low response rate, so we need to take these results with a grain of salt.”

Client: “No problem. Send me the link to the survey. I’ll take the survey a dozen times, and then the response rate will be higher.”

Evaluator: “Sorry, that’s not how it works.”

Client: “Then give me a paper copy of the survey and I’ll make photocopies until we have enough responses.”

Impossible response rate

Formatting Issue

Evaluator: “Here are the results from your program.”

Client: “Uh oh, the results don’t look good. The graphs aren’t going up. Can you re-format the graph to make sure all the bars are going upwards over time?”

Don't look at the axis

Defining Outlier

Evaluators: “Here are the results from your program.”

Client: “Those results aren’t accurate.”

Evaluators: “How so?”

Client: “The bad results are obviously outliers. You need to remove those people from the sample.”

Evaluators: “We define an outlier as (1.5 x the interquartile range) below quartile 1 or above quartile 3. Other evaluators define outliers as 3 standard deviations above or below the mean. We checked, and those people are not outliers. In fact, their experience in the program was pretty typical.”

Client: “Sorry, I didn’t realize it was such a hassle to fix. I didn’t mean to create more work for you. Just send me the Word version of your report and I’ll delete that section myself.”

Outlier is someone who doesn't like our program

Whoops Typo

Evaluator: “Here are the results.”

Client: “I know our program only had a 38% success rate, but can you type 83% in the report to our funders? 83% sounds better than 38%. If anybody notices, just say you accidentally made a typo.”

Report written on backwards day

Staying Funded

One more cartoon, just to put the fails in context…

You better show great results

Additional Cartoons

I’m curious, what ethics fails have you witnessed? Anything you can share or would you need the blurry picture and garbled voice treatment too?

Update 1: Cherry-Picked Sample

Thanks to Maria Gajewski for the comment that inspired this cartoon!

My favorite is the cherry-picked sample. I was involved in a project where directors only wanted to survey students whose families were still involved in the program. It’s not too difficult to figure out families who had a bad experience would not remain with the program, but the directors just couldn’t seem to grasp this when I pointed it out!

Next time, send this cartoon to the directors 🙂

Cherry Picking Sample


Update 2: Consequences

Ok, here is another comment inspired cartoon (thanks bridgetjones52).  And a big thank you to everyone else for all the comments and shares!

When presenting results of evaluation, very very senior manager ‘informed’ us that there would be consequences!!!

wpid-Photo-Jun-26-2013-131-PM.jpg

Written by cplysy · Categorized: freshspectrum

Feb 15 2024

Building Your Creativity Toolkit

“Creativity is not a talent. It is a way of operating”

These are words that came from comedy icon, John Cleese. Head to YouTube if you want to watch one of his talks on creativity, and the source of this quote.

The quote itself has really stuck with me over the years as I have attempted to bring more creativity to the research and evaluation worlds I work within. Especially when I work with academically trained individuals, who are brilliant but also lack the necessary creative training and experience required to thrive in a modern digital world.

Creativity is not one of those “you either have it or you don’t” kinds of things.

It’s a process.

And as a process, it’s something that can be taught, learned, and practiced.

Announcing my upcoming mini-workshop series.

Throughout 2024 I am going to hold a series of single session live virtual workshops (at least 6). Each of these little workshops is going to focus on a single practical method that once learned, can be added to your own personal creativity toolkit.

Here are the specific topics I have planned (for the first 6 sessions).

  • Single Panel Comics
  • Icon Arrays & Pictograms
  • Simple Maps
  • Timelines
  • Annotated Charts
  • Before & Afters

These sessions are not yet scheduled, but will be announced individually in the coming months.

There is only one way to enroll right now.

Want to be pre-registered for all 6 live sessions? Which will include lifetime recording access.

It’s simple. Register for next week’s Everyday Visual Reports workshop.

The most effective types of evaluation and research reports are short, clean, and visual (not long and complicated).

In this highly practical live course you’ll learn:

  • How to design effective short visual reports for use as fact sheets, executive summaries, case studies, method briefs, and more.
  • How to apply fundamental graphic design principles to give your reports that modern professional feel.
  • A process you can use that will benefit both the writing and design of your report.

Registration in this course includes:

  • Two live 90 minute sessions (on February 20 & 22 at 10 AM Eastern).
  • Forever access to the recordings.
  • Optional-to-attend after session Q&As (I’ll hang around for questions up to 30 minutes after each session).
  • One year of office hours with Chris Lysy (a $250 value).

*Bonus* Creativity Toolkit Series

  • Entry to 6 live single session mini-workshops to be offered throughout 2024. Dates/times TBD.
  • Topics Include: Single Panel Comics, Icon Arrays & Pictograms, Simple Maps, Timelines, Annotated Charts, Before & Afters.
  • Forever access to the recordings.

Written by cplysy · Categorized: freshspectrum

Feb 08 2024

5 Baby Steps to Better Reports

A couple of years ago I put out a book called the Reporting Revolution. And while I still believe just about everything I wrote in that book, I know many of you are not actually looking to start a revolution. You just want to start creating better reports.

So, with that in mind, today’s post is just a collection of baby steps. Simple things you can do now to improve your reporting.

1. Don’t focus on making your long report look better.

Your long report will only ever reach a small audience, even if it’s fantastic. And longer reports usually take lots of time and effort to make them pretty. It’s far more valuable to put that time you would spend updating your longer report into creating short reports.

2. Create a slidedoc.

A slidedoc could replace your long reports, but it doesn’t have to replace one to be useful. Slidedocs are simply just fantastic adaptations. Slidedocs are easier to create than infographics, and offer far more utility.

The easiest way to think through a slidedoc design is to consider it like a really nice visual presentation that doesn’t require a presenter to deliver. If you are already creating nice visual presentations, start from the slidedecks and just add words.

If you want a little more guidance on where to start, I wrote a blog post on slidedocs a couple of years ago that is still very relevant.

3. Create two graphs instead of one.

Don’t agonize over chart choice before you start designing. Instead go with a basic chart (like a bar graph) and then create something fancy (like a dot plot or slope graph) with the same data. Now you have choices that can be compared and contrasted.

This is useful if you are on your own, but it’s especially useful if you are working with a team. A “this one or that one” conversation produces far more useful comments than a “yes or no” or “what do you think of this” conversation.

4. Always create at least one micrographic with any report.

Ask yourself, “if someone is going to share this on social media, what image would go along with the post?” Don’t just fall back to the report cover. Find a particularly interesting chart, question, or finding from your report. Then feature it in a slide-sized little infographic.

Here is a post I wrote with tips on creating simple infographics.

5. Add some white space.

If your pages are wall to wall text, it’s going to feel too dense to read.

Page count restrictions are deceiving. It’s almost always better to create a report with more pages and more space around the words than it is to create a report with fewer, but more dense, pages.

For tips on how to do this check out this short video, Ditch the Text Walls, Embrace the White Space!

Want more tips?

You should consider joining my upcoming live course, Everyday Visual Reports, which will be taught on February 20 & 22. This course is designed to be super practical with things to learn at all skill levels.

Written by cplysy · Categorized: freshspectrum

Jan 31 2024

Is your team, report deficient?

Long, boring, dusty-shelf reports might be a problem, but it’s rarely the biggest problem most data teams face.

When teams decide to start tackling their report design problems, that’s where they start. They think that if they can turn their long, boring, dusty-shelf report into something that’s not as long, not as boring, and more enticing to read, everything will be better.

So they commit most of their reporting resources towards that goal. Which just leads to shorter, more interesting, dusty-shelf reports.

Report deficiency should be the first problem you tackle.

The easiest shortcut to better serving modern audiences is to create more reports. Reports of different lengths, in different formats, and with audience tailored content.

The half-life of any piece of content shared today is remarkably short. So an org with only one really good report has two options, to share it once and move on or spam share it over and over again.

Nobody likes being spammed by an organization trying to push their one big report. But by altering formats, lengths, and content you create additional sharing opportunities that don’t feel forced. You also make it easier for those reports to be shared with different audiences.

The two basic ways to treat report deficiency

The first is to increase frequency.

Higher frequency lets you develop an audience. If you only share a single report once every year you don’t have much of an opportunity to grow and cultivate a report audience.

Blogs and email newsletters are likely the easiest ways to increase frequency. But you can also just create shorter visual reports more often, establishing a cadence that can help you grow that audience.

The second is to increase variety.

Don’t just share one big annual report. Or, if you do, adapt that long report into a collection of different formats (ex. short visual reports, infographics, videos, webinars, presentations, courses, slidedocs, etc.).

These different formats create more opportunities to share your work that feel natural and organic, not spammy. They also give your collaborators (colleagues, program teams, executives, academics, politicians, etc.) choices in how they share your work with broader audiences.

Want to learn some easy ways to create effective everyday visual reports?

I’ll be teaching a live public half-day virtual workshop on designing everyday visual reports.

In this highly practical live course you’ll learn:

  • How to design effective short visual reports for use as fact sheets, executive summaries, case studies, method briefs, and more.
  • How to apply fundamental graphic design principles to give your reports that modern professional feel.
  • A process you can use that will benefit both the writing and design of your report.

Registration in this course includes:

  • Two live 90 minute sessions (on February 20 & 22 at 10 AM Eastern).
  • Forever access to the recordings.
  • Optional-to-attend after session Q&As (I’ll hang around for questions up to 30 minutes after each session).
  • One year of office hours with Chris Lysy (a $250 value).

Written by cplysy · Categorized: freshspectrum

  • « Go to Previous Page
  • Go to page 1
  • Interim pages omitted …
  • Go to page 10
  • Go to page 11
  • Go to page 12
  • Go to page 13
  • Go to page 14
  • Interim pages omitted …
  • Go to page 54
  • Go to Next Page »

Footer

Follow our Work

The easiest way to stay connected to our work is to join our newsletter. You’ll get updates on projects, learn about new events, and hear stories from those evaluators whom the field continues to actively exclude and erase.

Get Updates

Want to take further action or join a pod? Click here to learn more.

Copyright © 2026 · The May 13 Group · Log in

en English
af Afrikaanssq Shqipam አማርኛar العربيةhy Հայերենaz Azərbaycan dilieu Euskarabe Беларуская моваbn বাংলাbs Bosanskibg Българскиca Catalàceb Cebuanony Chichewazh-CN 简体中文zh-TW 繁體中文co Corsuhr Hrvatskics Čeština‎da Dansknl Nederlandsen Englisheo Esperantoet Eestitl Filipinofi Suomifr Françaisfy Fryskgl Galegoka ქართულიde Deutschel Ελληνικάgu ગુજરાતીht Kreyol ayisyenha Harshen Hausahaw Ōlelo Hawaiʻiiw עִבְרִיתhi हिन्दीhmn Hmonghu Magyaris Íslenskaig Igboid Bahasa Indonesiaga Gaeilgeit Italianoja 日本語jw Basa Jawakn ಕನ್ನಡkk Қазақ тіліkm ភាសាខ្មែរko 한국어ku كوردی‎ky Кыргызчаlo ພາສາລາວla Latinlv Latviešu valodalt Lietuvių kalbalb Lëtzebuergeschmk Македонски јазикmg Malagasyms Bahasa Melayuml മലയാളംmt Maltesemi Te Reo Māorimr मराठीmn Монголmy ဗမာစာne नेपालीno Norsk bokmålps پښتوfa فارسیpl Polskipt Portuguêspa ਪੰਜਾਬੀro Românăru Русскийsm Samoangd Gàidhligsr Српски језикst Sesothosn Shonasd سنڌيsi සිංහලsk Slovenčinasl Slovenščinaso Afsoomaalies Españolsu Basa Sundasw Kiswahilisv Svenskatg Тоҷикӣta தமிழ்te తెలుగుth ไทยtr Türkçeuk Українськаur اردوuz O‘zbekchavi Tiếng Việtcy Cymraegxh isiXhosayi יידישyo Yorùbázu Zulu