• Skip to main content
  • Skip to footer
  • Home

The May 13 Group

the next day for evaluation

  • Get Involved
  • Our Work
  • About Us
You are here: Home / Archives for allblogs / freshspectrum

freshspectrum

Dec 27 2023

Should DataViz be Easy?

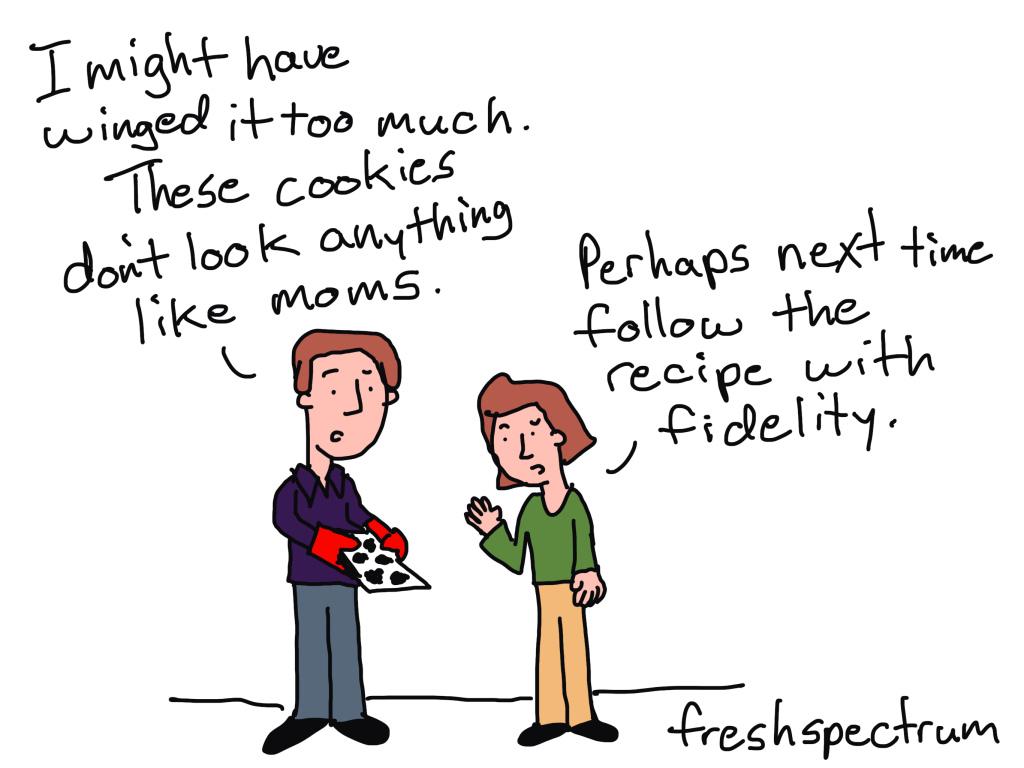
For Christmas dinner this year I made my family spinach and pasta rotolo. It’s a baked pasta dish that involved making fresh pasta, rolling it flat, filling it with a spinach/ricotta mixture, and rolling it up like a jelly roll. Then it gets cut into small little scroll like pieces and baked upright with a homemade creamy parmesan rosé sauce until the top ends of the pasta crisp up.

And while it ended up a bit of a mess and not quite picture perfect, it was delicious.

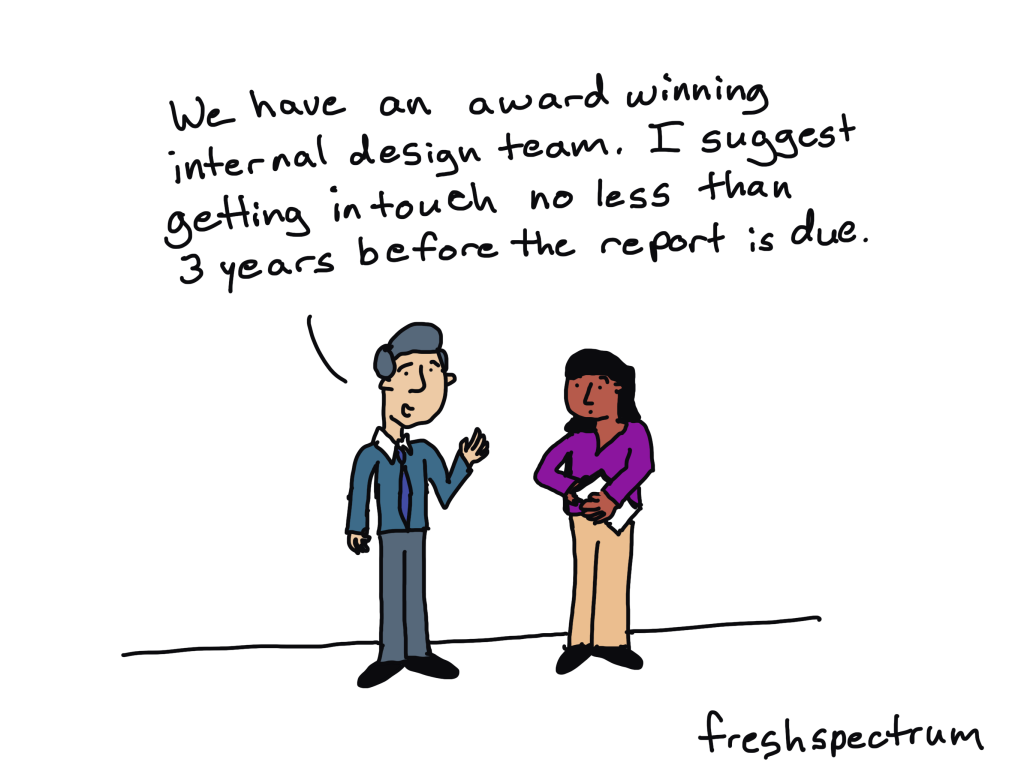
Years ago, pre-covid and before we were vegetarians, my in-laws would take us out to a fancy restaurant for Christmas eve dinner. It was a long multi-course meal that usually included the kind of fancy dishes you would never make at home.

Both of these examples are the kinds of things you don’t do often. They either require too much work or too much money to be a regular thing for most people.

That’s certainly true for us. The rest of the year our pasta comes from a little cardboard box with sauce that comes from a can. And the only time we have a multi-course meal is when one of us opens up a bag of chips to snack on before dinner.

Sometimes you want special. But most of the time, you just need to eat.

Comic Guy Says, "We have an award winning internal design team. I suggest getting in touch no less than 3 years before the report is due."

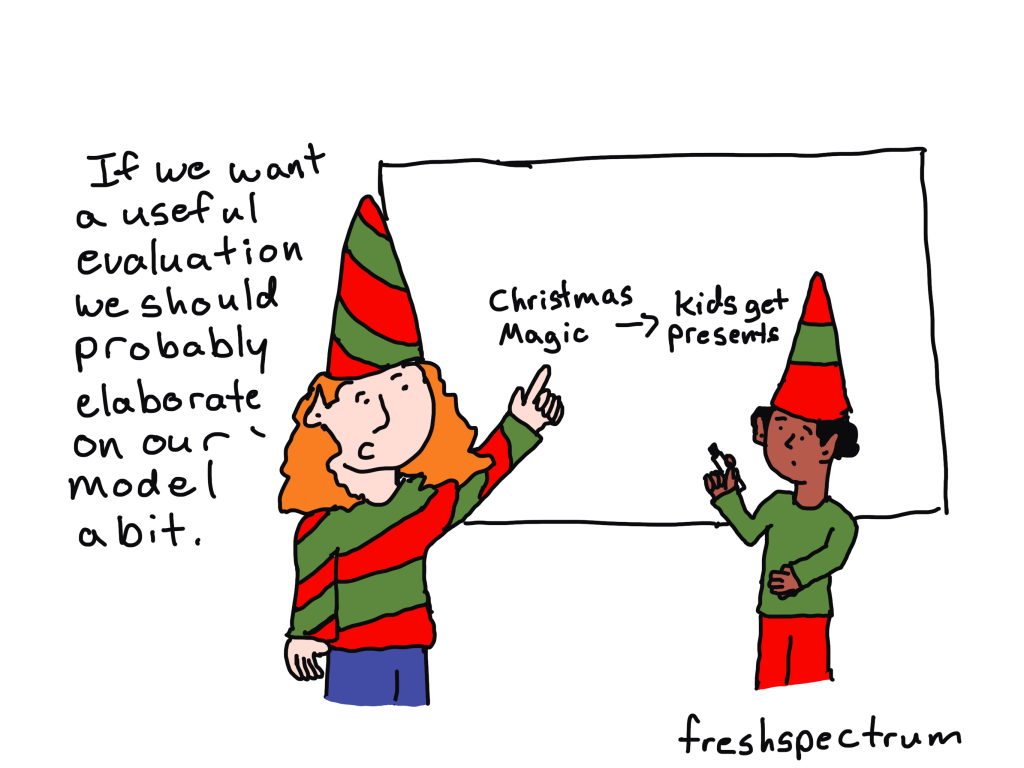
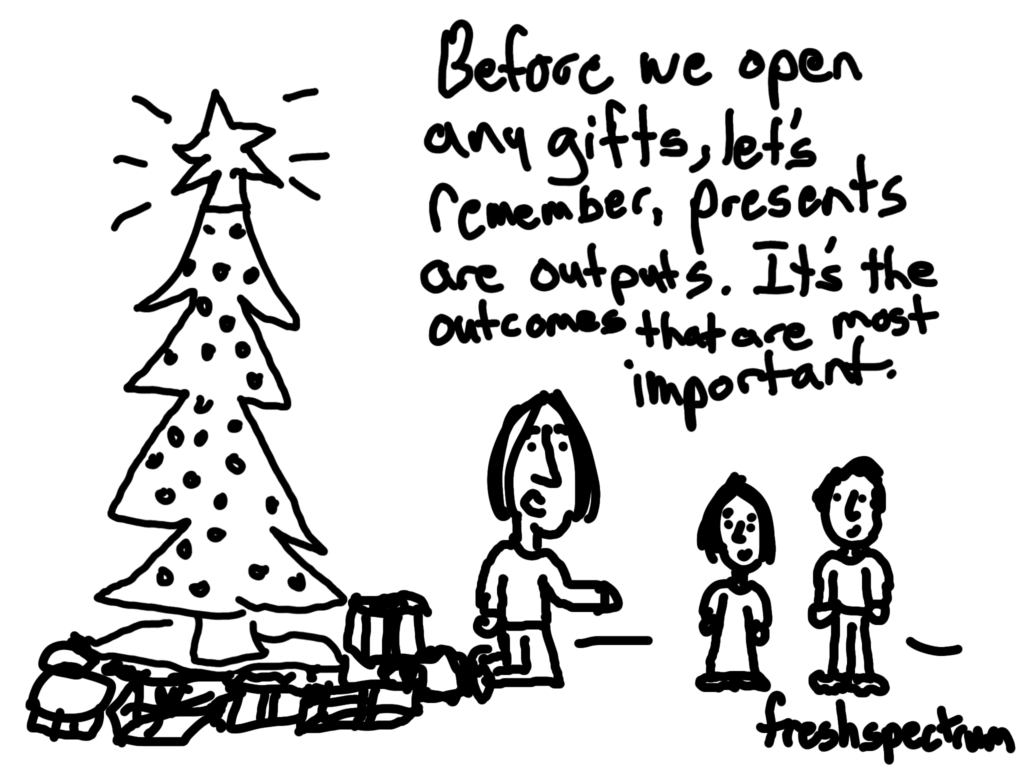
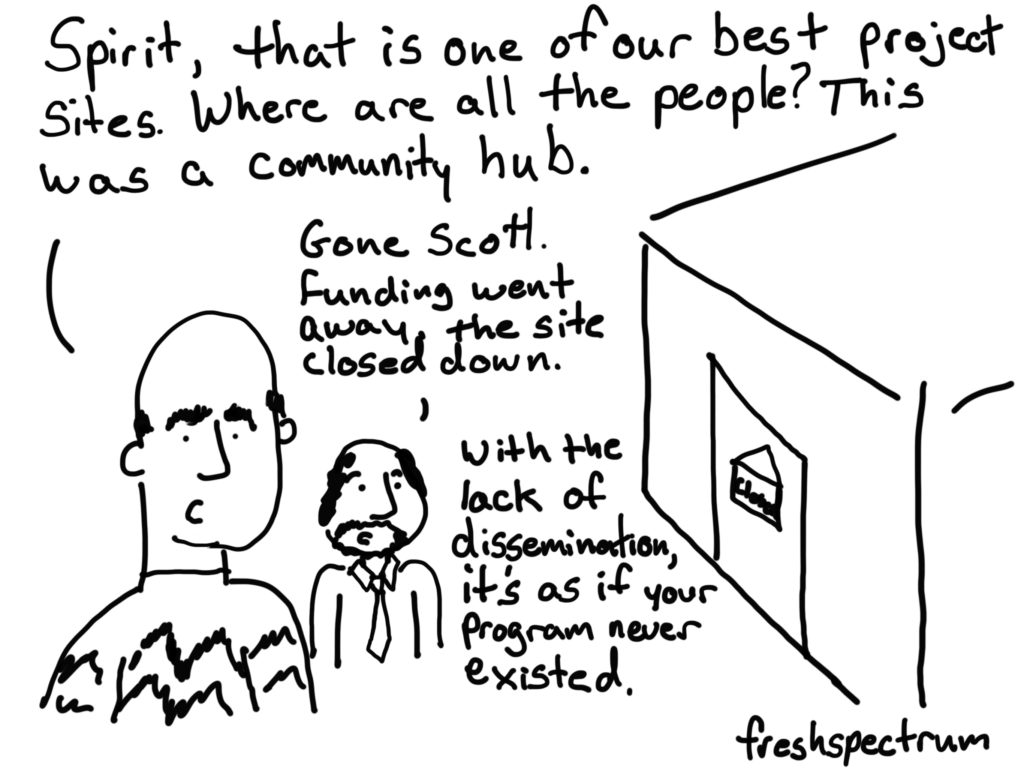
DataViz is not just for special occasions.

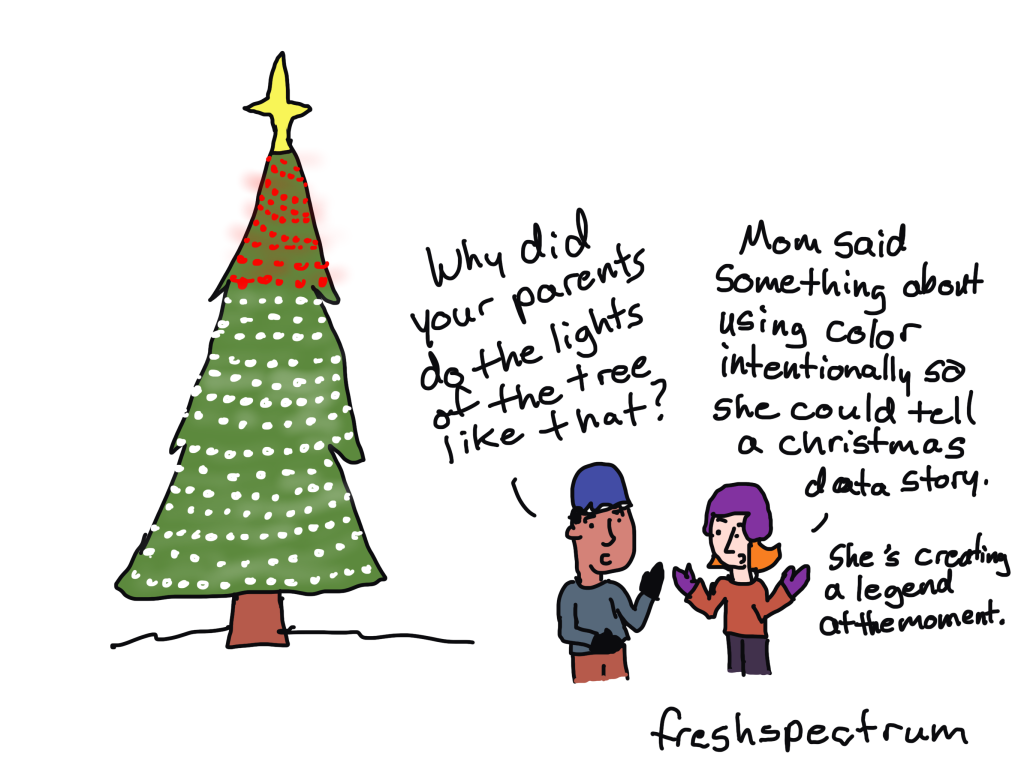
Visuals are important.

And when there is too much information for people to process, visuals are even more important.

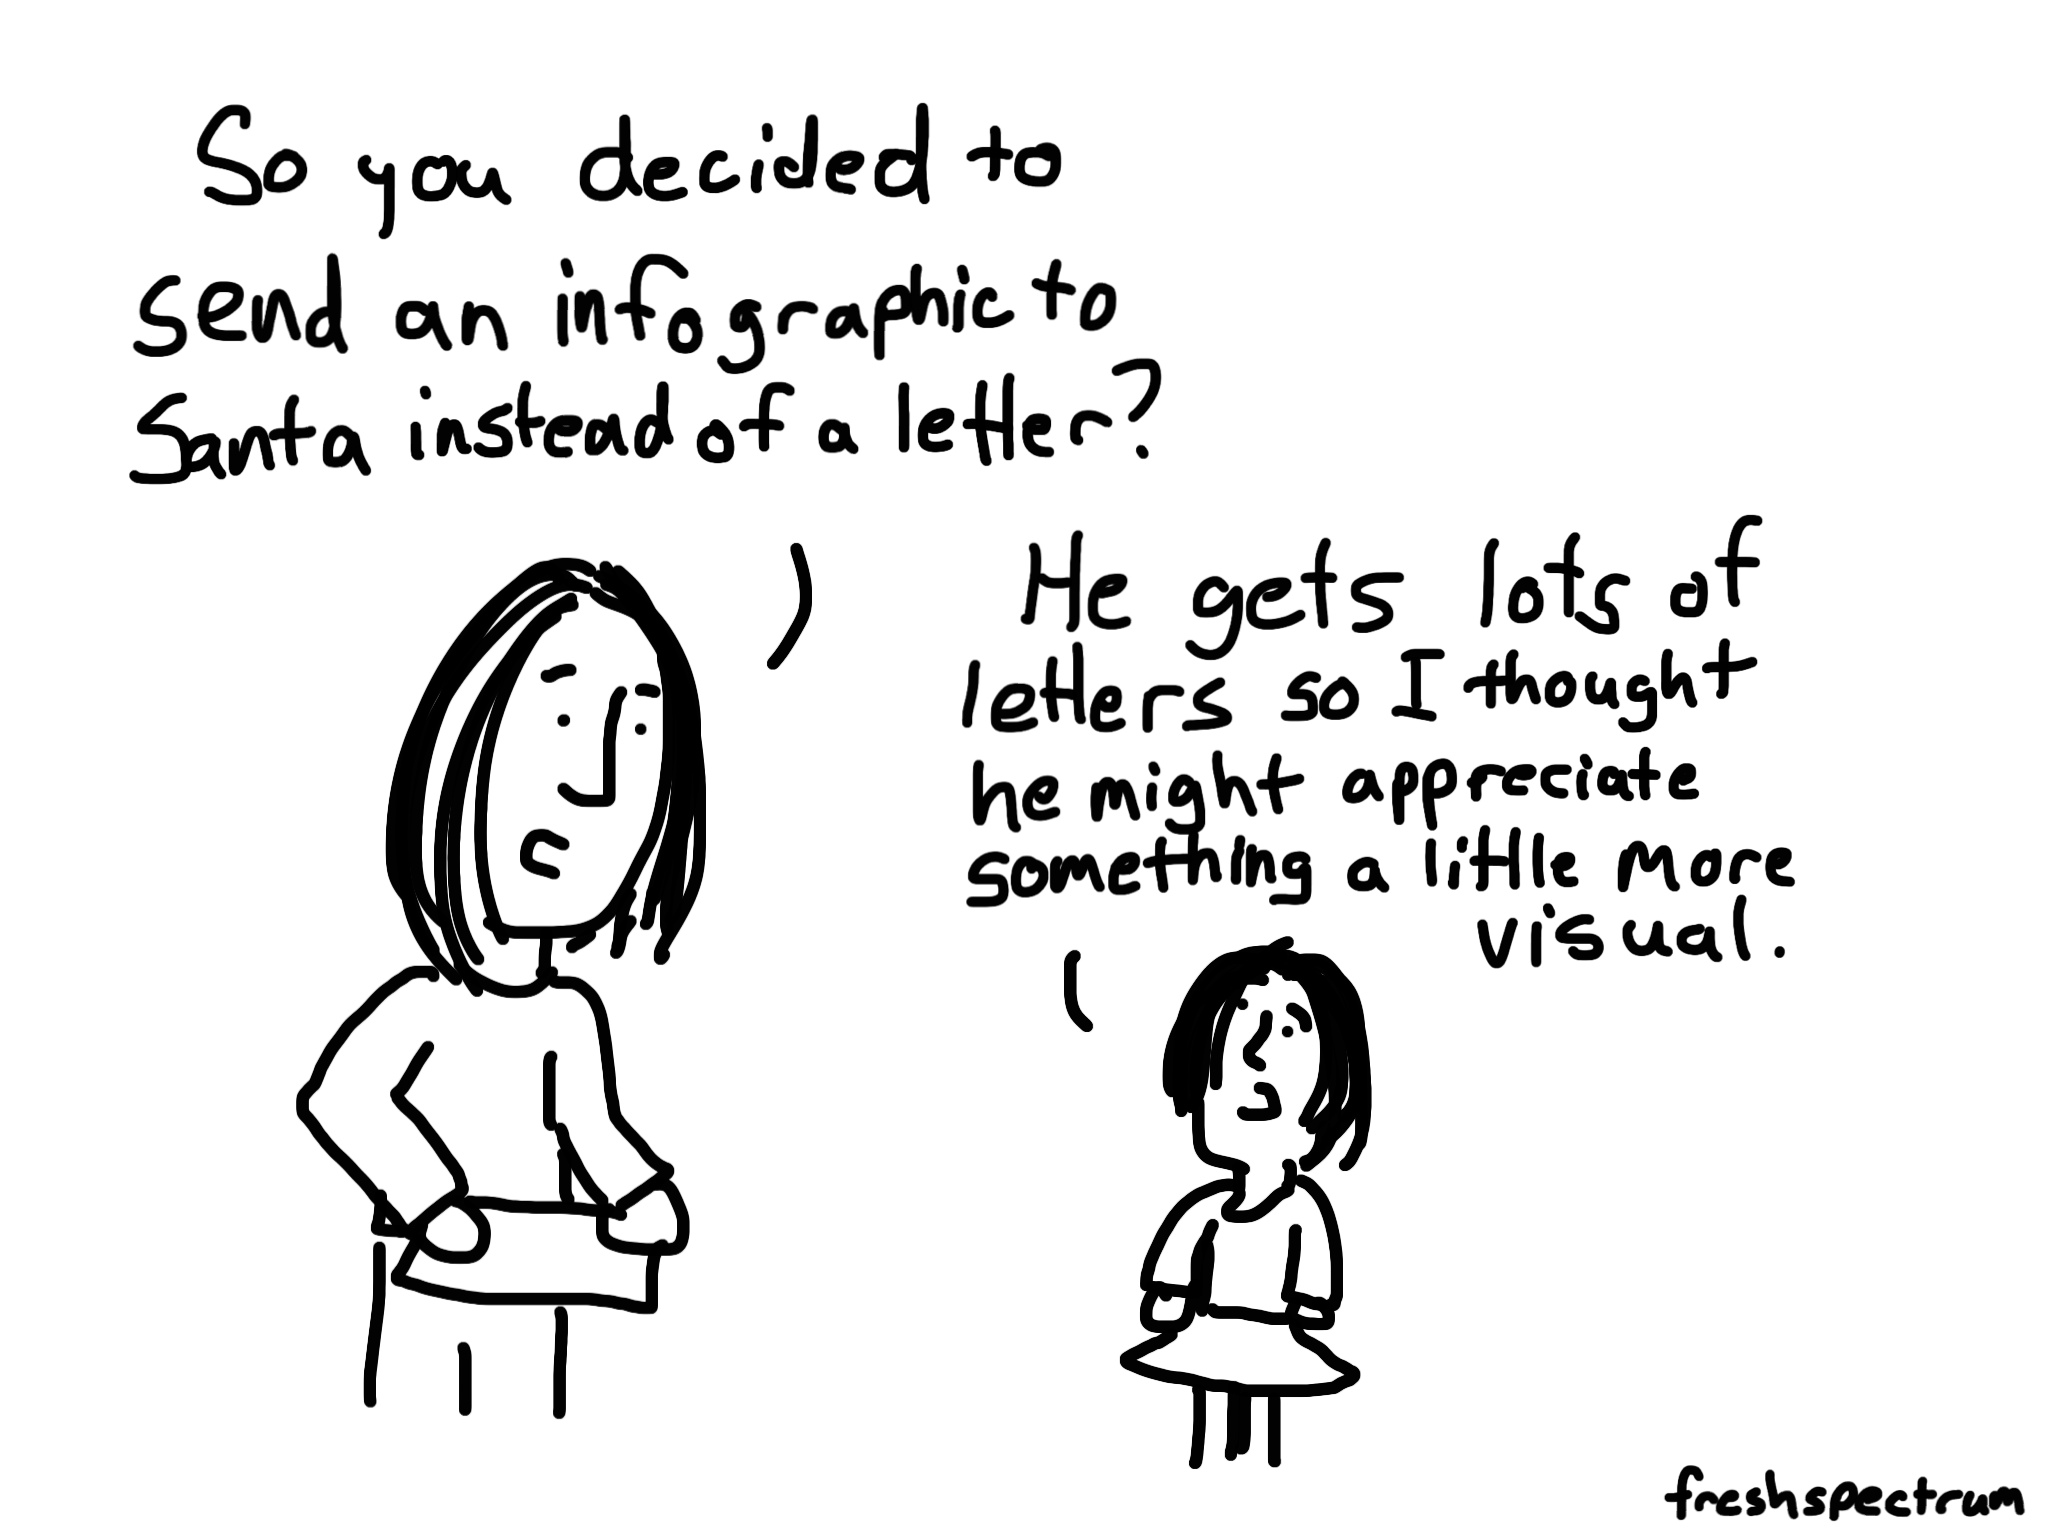
Without pictures the web would just be overwhelming blocks of text. It’s why most social media platforms look like living comic books. Visuals allow us to scan before we decide to dive in and read. In essence, the pictures are critically important navigation tools.

I joke sometimes that data visualization is really just academically acceptable illustration. In settings where you have to defend the inclusion of any image, such as an academic journal, a chart gives you a simple way to include pictures. But most of the time, even including those kinds of pictures was not requirement.

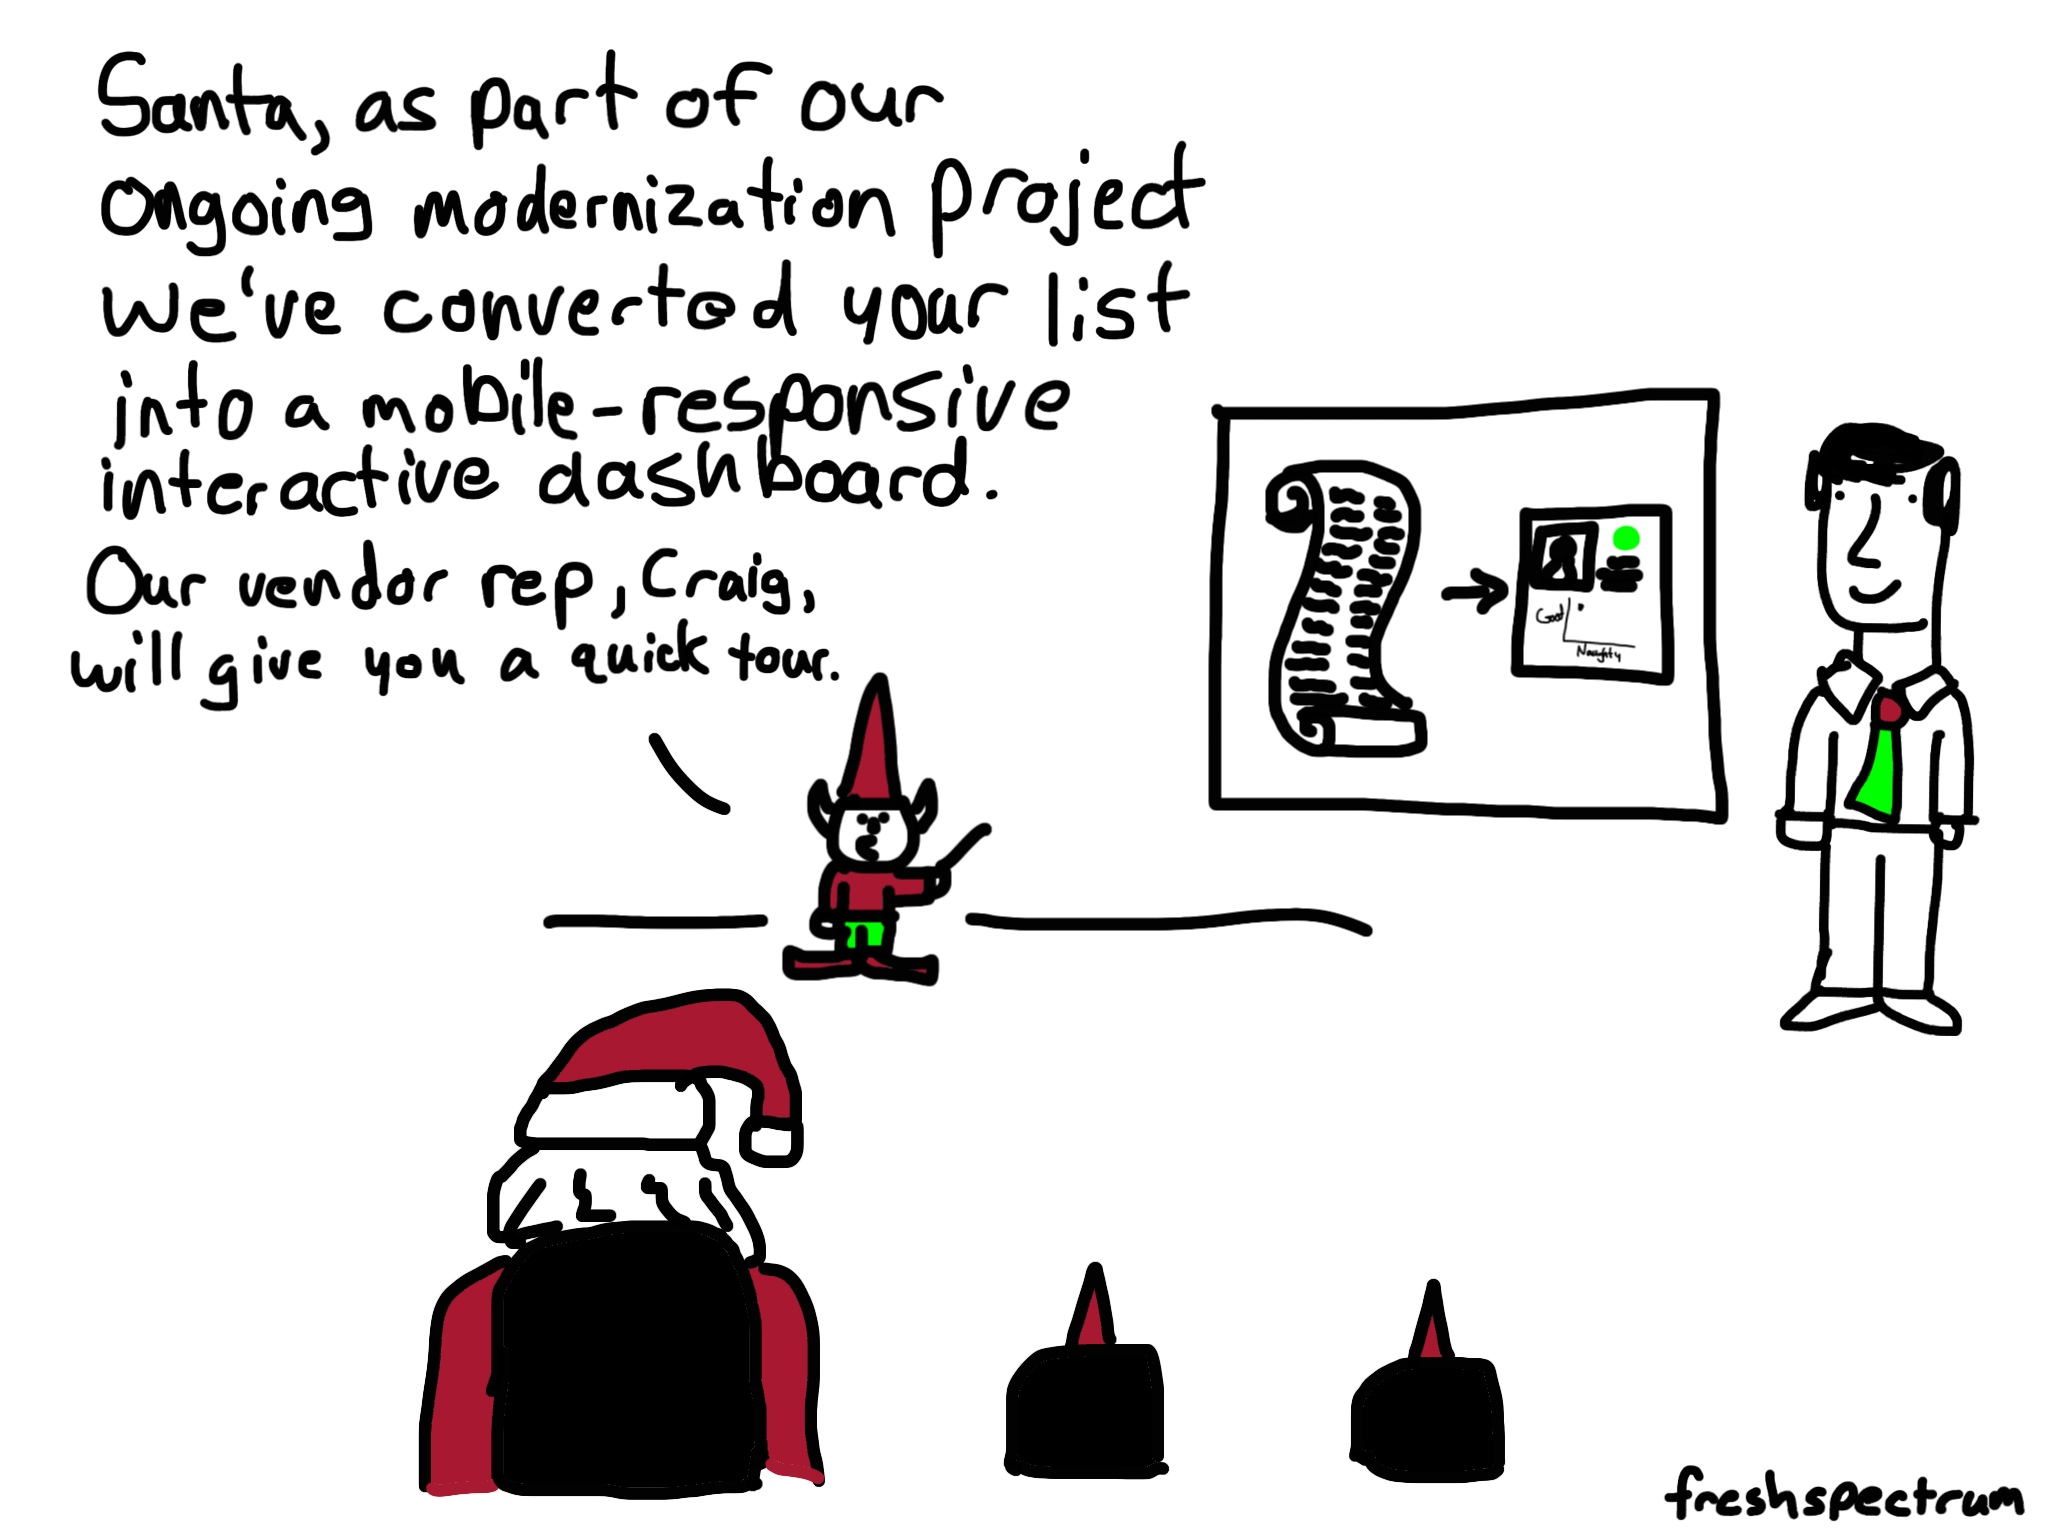
Now-a-days that’s changing. DataViz and good design are no longer just for special occasions.

Comic Lady Says, "Not sure how they did it. It's only a 3 page executive summary but it reads like a 50 page report."

DataViz home cooks wanted.

Some of the coolest innovations over the last decade are not tools that allow us to do things that have not been done before. Instead they are things that bring better dataviz and design to the masses.

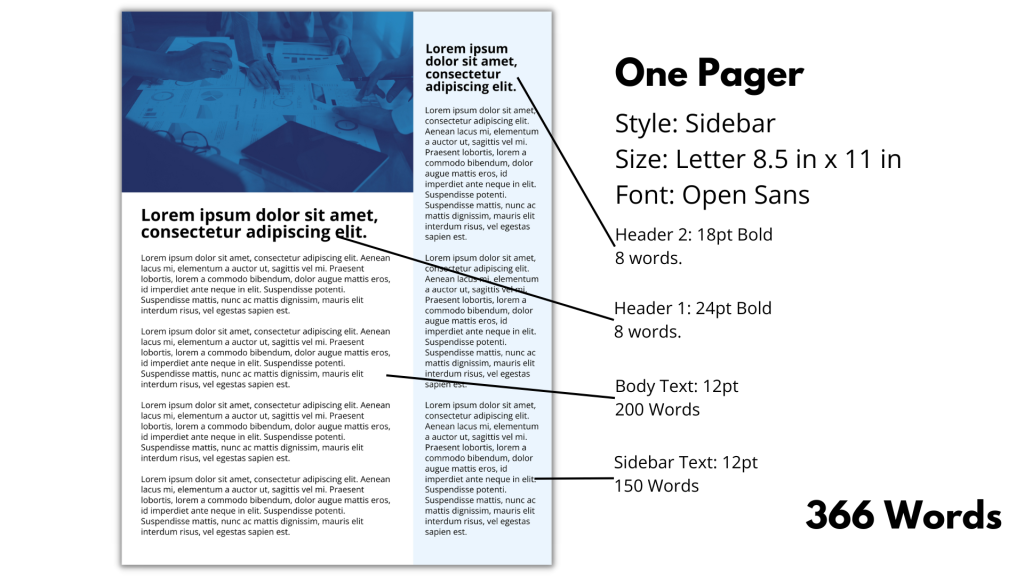
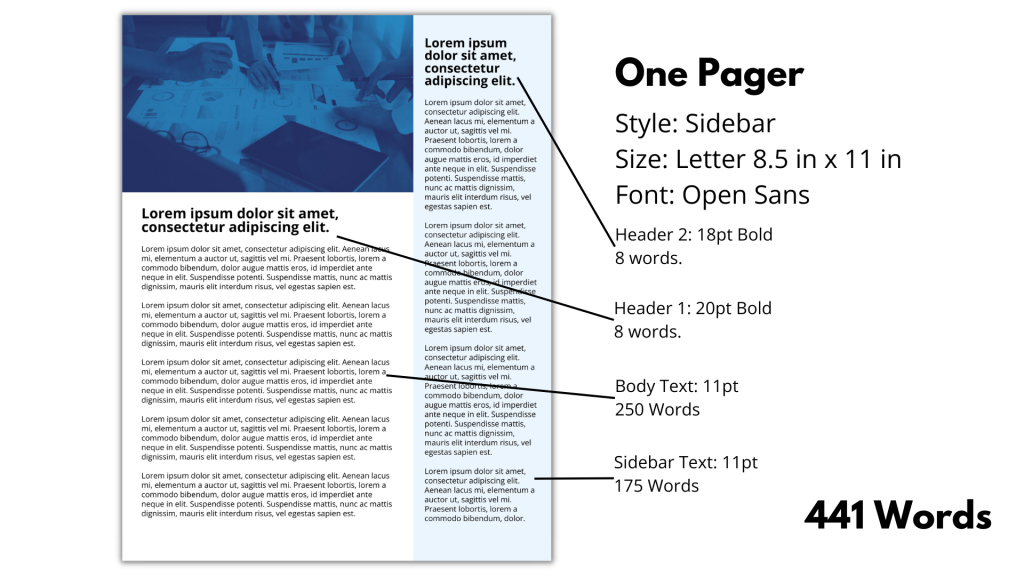
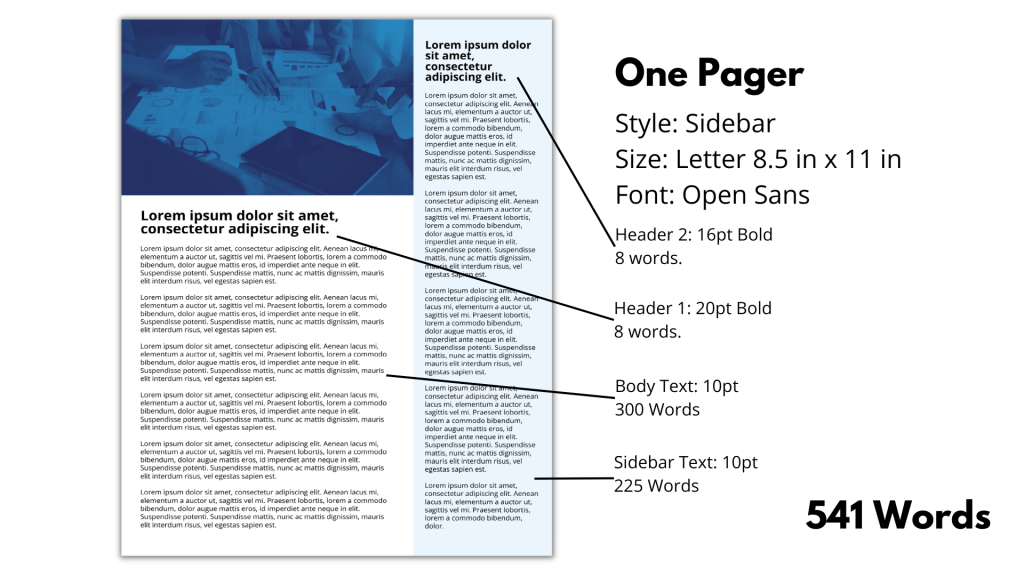
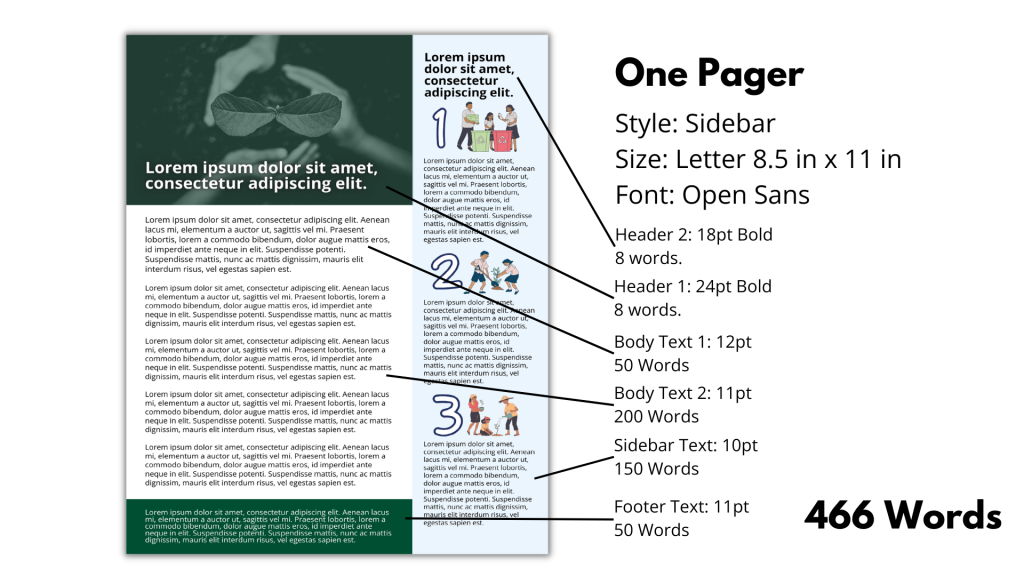
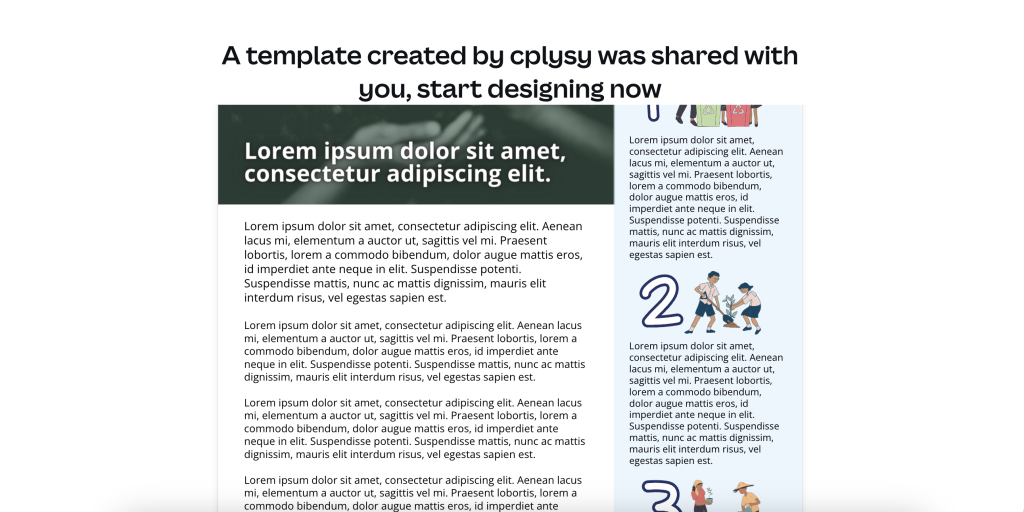
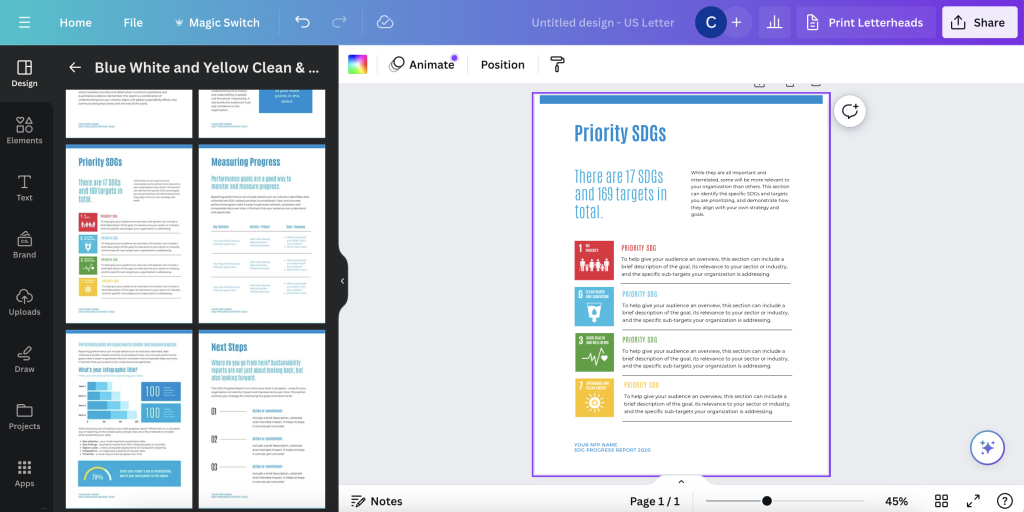
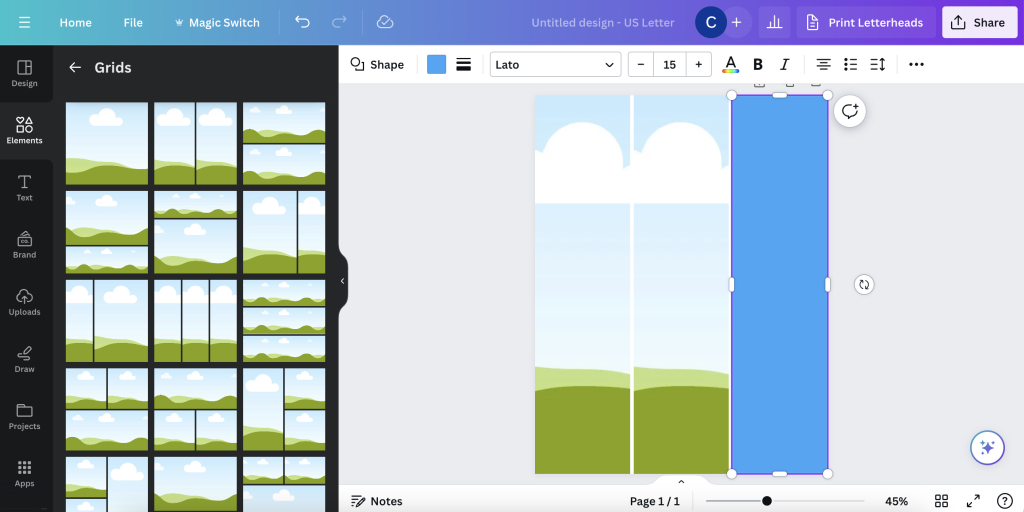
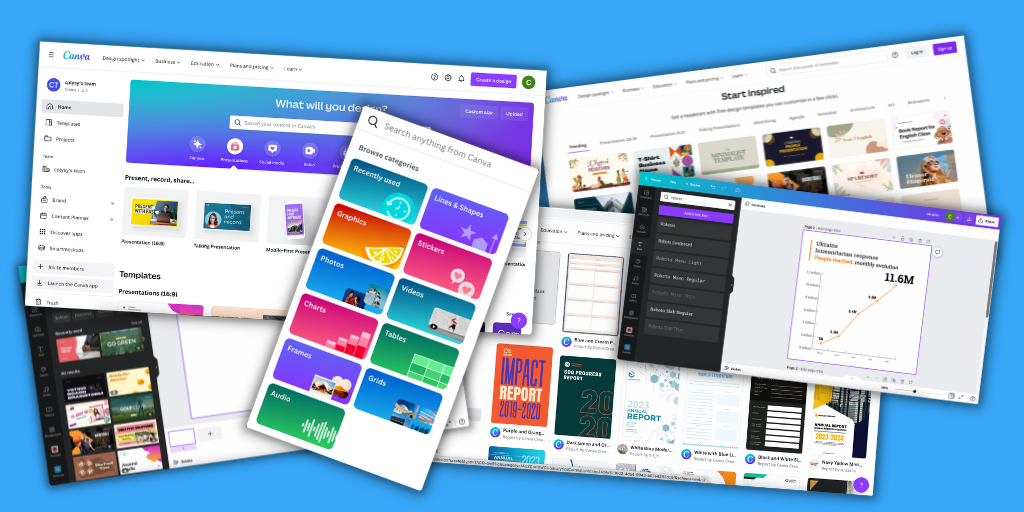
  • You don’t need a deep dive into Adobe creative cloud to create high quality infographics. You can start with Canva.
  • You don’t need a deep dive into javascript, R, or python to creative interactive web reports or apps. You can start with a WordPress website builder.
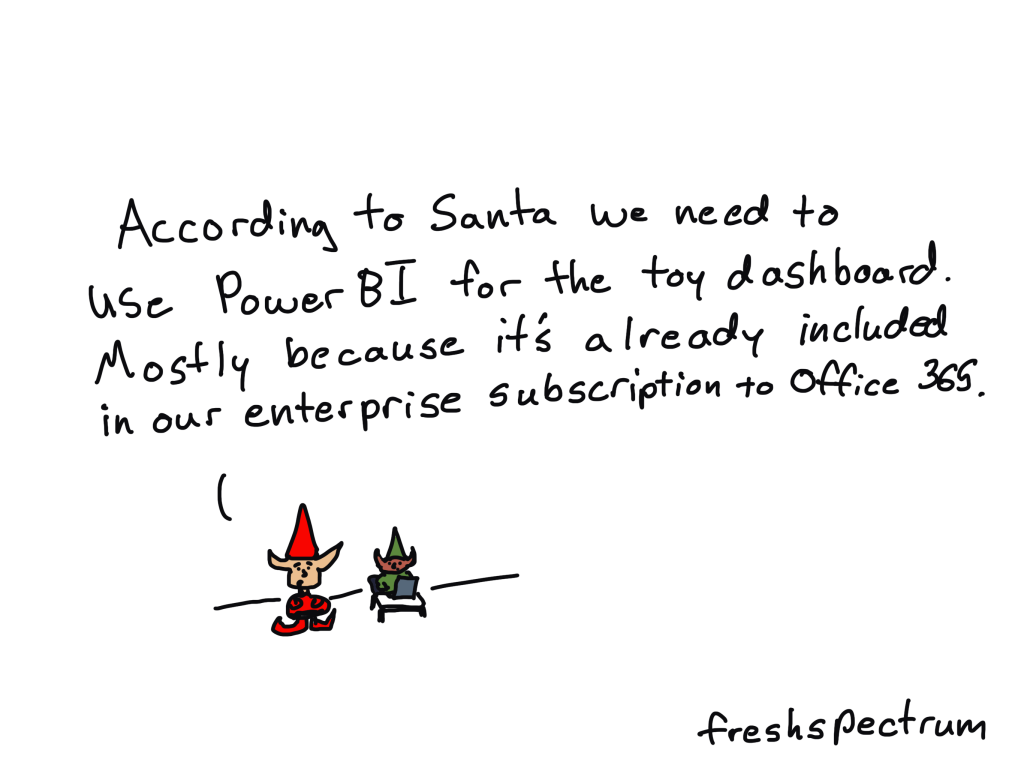
  • You don’t need a deep dive into Tableau or PowerBI to create automated interactive charts. You can start with Flourish or Datawrapper.

With these new tools, and the right process, you can create high quality DataViz and designs easier and faster. And most people won’t know the difference (including your boss or clients).

Comic person 1, "We found the best reporting strategy mixes infographics, dashboards, and slidedocs in order to best meet the needs of our different audiences."
Comic person 2, "But the contract only lists one report."

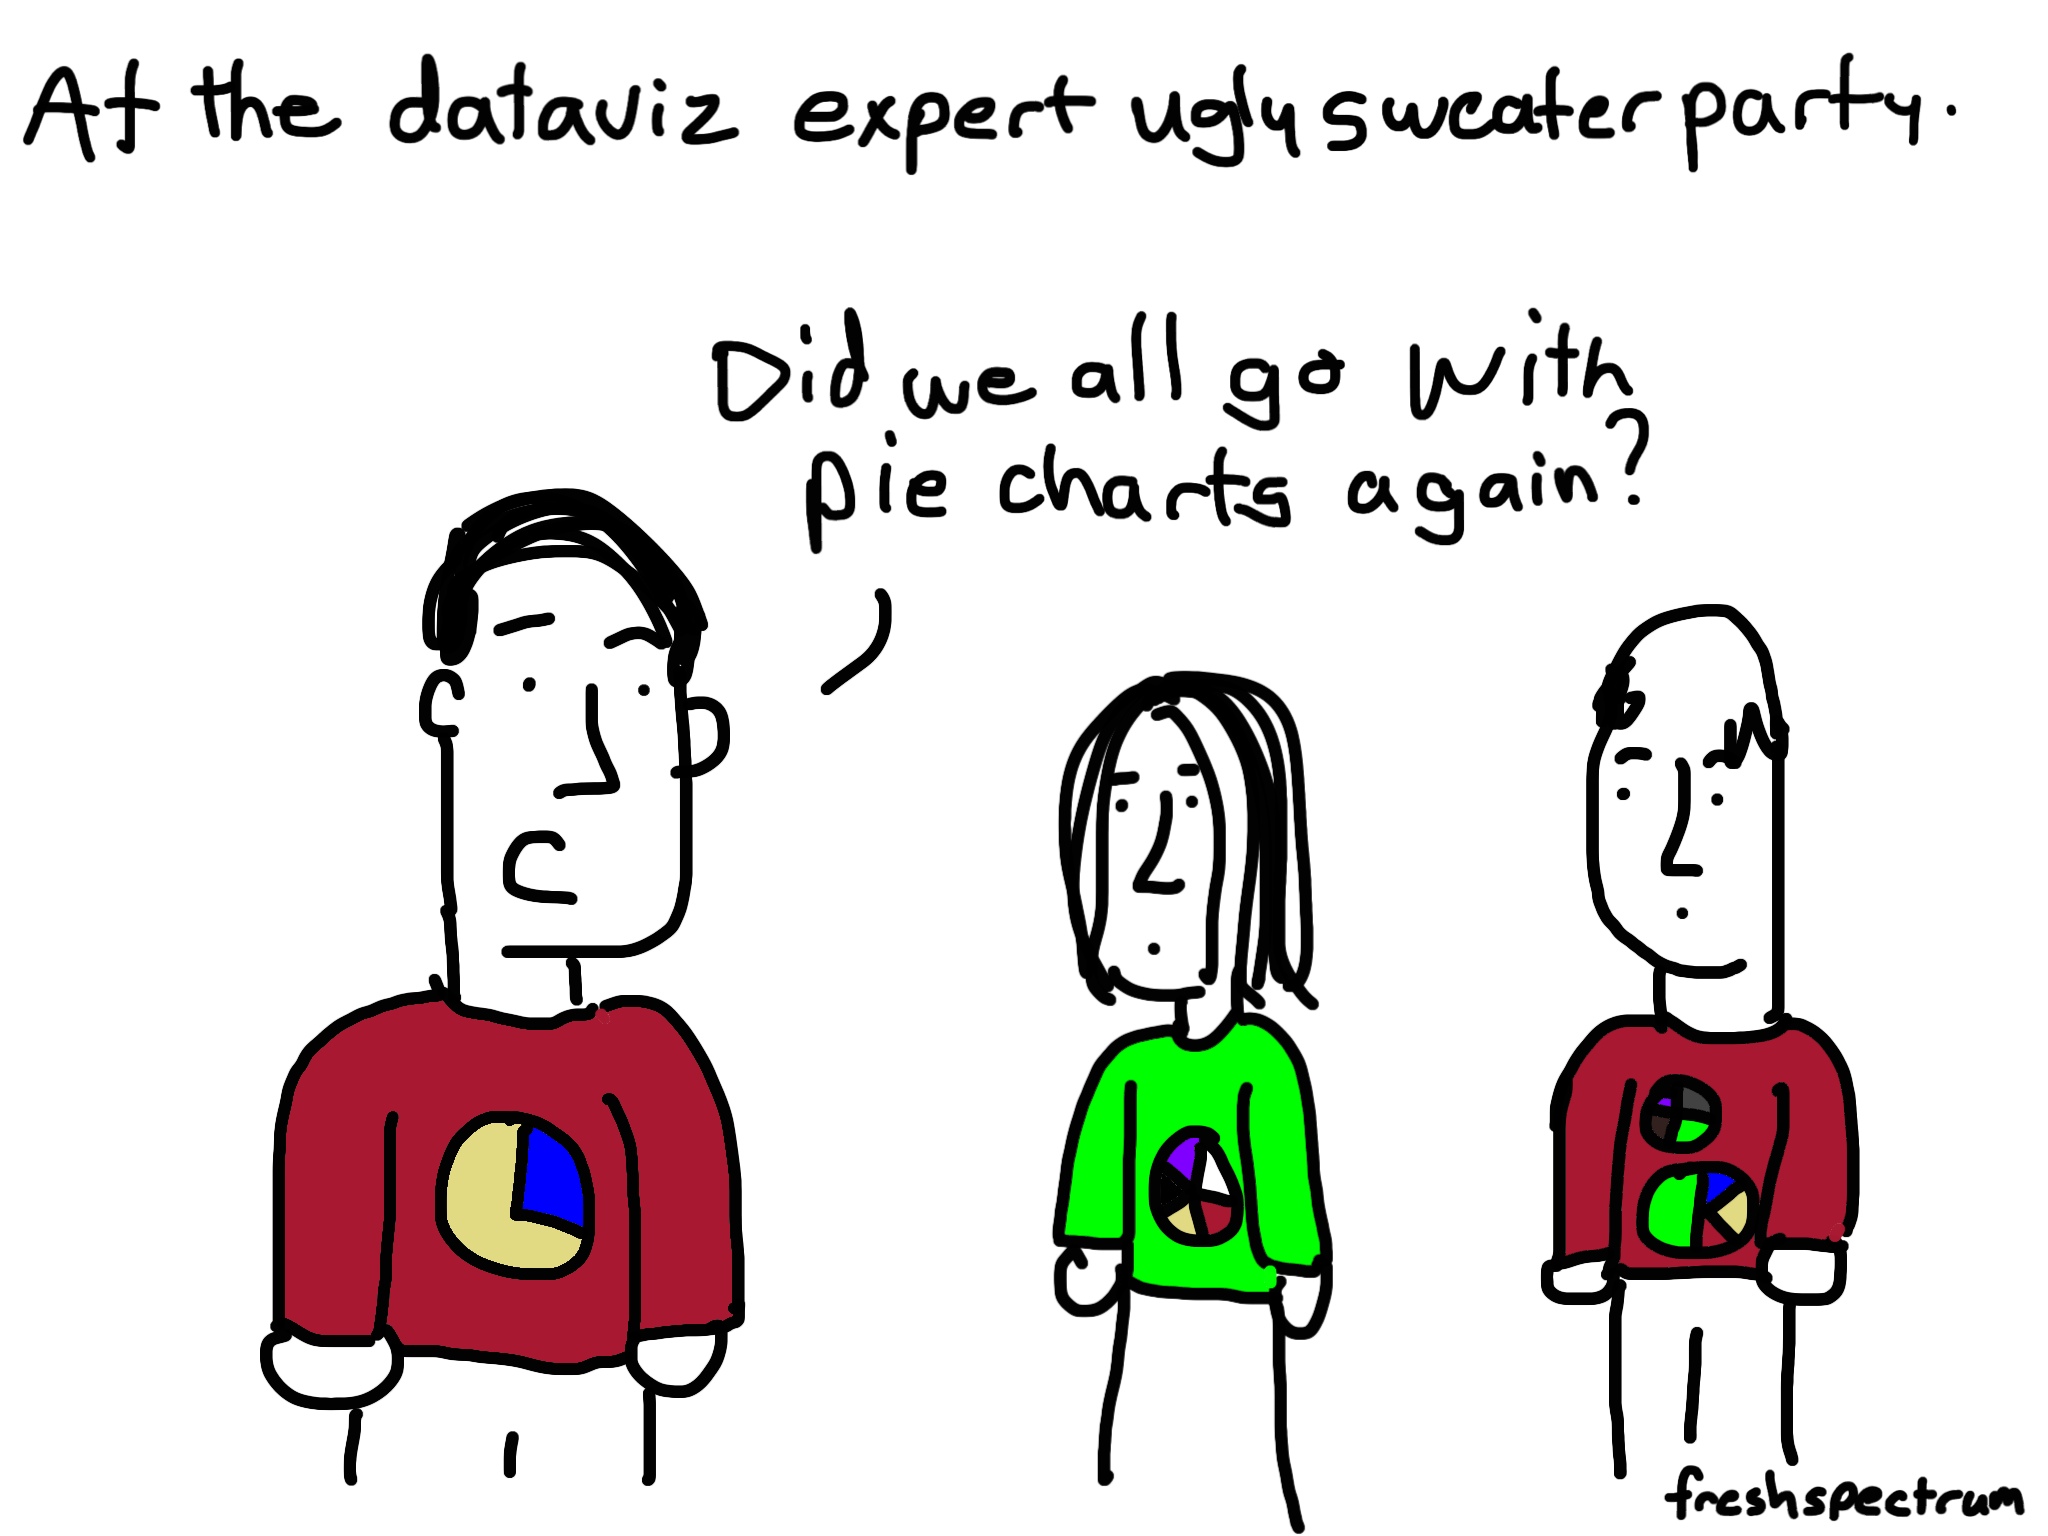
So, should DataViz be easy?

Yes.

YES!!!

I would love it if more organizations put more time and money into DataViz and design. But until that happens, I think the best thing we can do as a data field is to learn how to use the tools we have to make the process easier and faster.

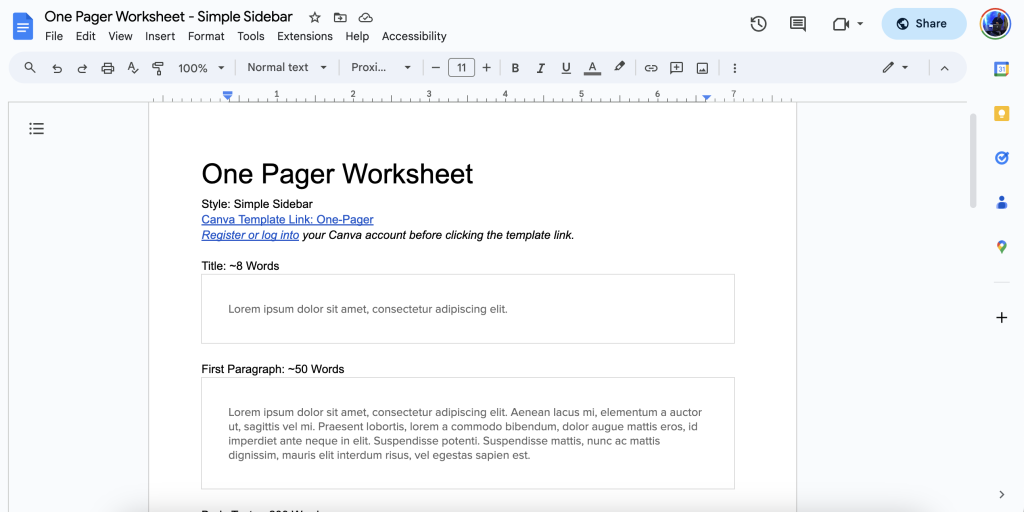
I and I hope with this blog, along with the workshops and courses I’m developing, I can continue to help make that process easier in the new year.

Written by cplysy · Categorized: freshspectrum

Dec 12 2023

More than 60 Holiday Data Comics

Are you looking for data and evaluation cartoons this holiday season? In this post I’ve pulled together all my Christmas and other holiday cartoons/comics I’ve drawn from across the years. With new cartoons added annually!

Comics from 2023

Power BI and Elves

Of course the elves don’t like PowerBI, but Santa paid a lot for that Office 365 subscription, so like or not…

Intentional Christmas Lighting

Anyone being more intentional in their Christmas tree lighting?

Baking Fidelity

Who needs logic models when you have Christmas magic?

I think it would be really hard to be an evaluator at the North Pole.

Tiny Font One-Pager

I debated using “Christmas Magic” as the way Santa would read the list. But cryogenic transmission electron microscope just felt right at the time.

Comics from 2022

Zero Carbon Santa

I wonder what Santa could use instead of coal.

Inbox Zero

Santa probably gets a lot of emails. But I doubt he’s the one reading them all. Some elf probably has that responsibility…

Ugly Sweater Contest

There was an ugly sweater contest at my office last week. I forgot about it but went to work wearing a sweater. The sweater wasn’t ugly, but it did inspire this cartoon.

Day Rate

When I talk to other indie consultants, especially new ones, my key piece of advice is that your hourly or daily rate doesn’t really matter. Budgets matter a lot more.

Take reindeer for example, they only one day a year. They might get a really good rate for that one day, but is it enough to keep them in reindeer food and shelter for the remaining 364.

Logic model is a little too simple.

Trying to think of evaluation stuff I haven’t talked about during past holidays. This one is based on the idea that a lame logic model can lead to a lame evaluation. Also, these are elves, but I think we’re a little too zoomed in for that to be noticeable.

Annual Reports

Do you think Santa makes the elves deliver a year end annual report? Seems like it would be a little bit of stressful deadline to me.

Comics from 2021

2020 2021 2022 Resolutions

I remember when the year started. Sure 2020 was a bust with COVID and all, but surely 2021 would be better…right?

So naive.

If you didn’t feel super productive or accomplished this past year, don’t worry. You are in good company with all the rest of us.

Freshspectrum cartoon by Chris Lysy.
Illustration of a Resolutions list, with 2020 and 2021 crossed out, then showing 2022.

Elfing from Home

You know if Santa allowed remote work we would see more elves around. Wonder if they are also part of the “great resignation.”

Freshspectrum cartoon by Chris Lysy.
Elf chatting with a person at the beach. "I used to work in HQ up north. But when the Big Guy started allowing remote, I hopped on the next plane."

Dissemination Magic

Every time a bell rings, a stakeholder reads your report.

Freshspectrum cartoon by Chris Lysy.
"Perhaps our dissemination strategy shouldn't rely entirely on Christmas magic."

Pot Luck Needs Assessment

I drew this cartoon even though I’m not sure if anyone is really potlucking these days. I still avoid any situation with unmasked non-family members. And everyone bringing a dish, yikes!

Freshspectrum cartoon by Chris Lysy.
"We should do a needs assessment before this year's holiday pot luck. Maybe that way we'll end up with more than just paper plates and potato chips."

RCT Christmas

It’s too easy to pick on RCTs.

Freshspectrum cartoon by Chris Lysy. "Honey, did you see this letter from the North Pole? They're going to do Christmas as an RCT. It's randoized, so we have no way of knowing whether or not the kids will get any gifts fro Santa."

Ghost Downsizing

Did you know that instead of spirits, Dickens first draft of a Christmas Carol featured three evaluators?

Freshspectrum cartoon by Chris Lysy. "Hello Mr Scrooge. My name is Ethan, I'll be your ghosts of Christmas past, present, and future. There used to be three of us but our org really cut back our evaluation budget."

Superspreader Christmas

Toyed with drawing a cartoon about Santa being high risk for COVID. You know given his weight, age, and habit of bingeing on cookies and milk.

Freshspectrum cartoon by Chris Lysy. "Mom, I'm worried Christmas might be a super spreader event. Santa literally goes into everybody's house. Think we should ask if he could leave our gifts on the porch like the Amazon guy?

It’s Christmastime in our household, so that means it’s time to switch from the unending string of professional Zoom calls to the somewhat smaller stream of extended family Facetime calls.

Zoom around the North Pole

But just because it’s the holidays, it doesn’t mean we get to take off our evaluator hats.  I’ve come to believe that no matter what I call myself professionally (information designer, web designer, data analyst, President and CEO, solopreneur), I will always be an evaluator on the inside. 

It’s more a way of life than a profession. A path that likely began far before you even heard of the profession.

Santa Satisfaction Survey

The trick is to not annoy too many of your family and friends with your evaluator-ness.  Like perhaps when you notice a significant other not following a recipe with fidelity, just let it go.

Cookie Recipe Fidelity

But there are certainly times when you can really embrace your evaluation side.  For instance, maybe your extended family drives you a little crazy.  Take back your holiday with the support of a nice new theory of change.

Happy Christmas Theory of Change

Of course, this post is showing up in your email inbox a little late for this winter holiday season.  Christmas is here. Kwanzaa and New Year’s will be here shortly. The Winter Solstice, Hanukkah, and Diwali have already come and gone.

Hopefully some of you were on the ball and have already administered your holiday pretests. How else are you going to be able to accurately identify any measurable increase in holiday cheer?

Holiday Pretest

Comics from 2020

Presents are Outputs

This is a cartoon I redrew in 2019 from an earlier iteration. Not sure it ever made it into a post.

Cartoon by Chris Lysy
"Before we open any gifts, remember, presents are just outputs. It's the outcomes that really matter."

Christmas Tree Chart

I believe this chart type may be a default in Excel.

Cartoon by Chris Lysy
"So I created this chart using a dual axis mix of a scatterplot and a line graph...The data is meaningless but it looks like a super cute Christmas tree, so I thought I would share."

Virtual Christmas

This cartoon is probably a good representation of my headspace last Christmas.

Cartoon by Chris Lysy
"Dear Santa, This year I encourage you to switch to a virtual Christmas. I know it won't be the same, but the numbers keep going up and since you are super old you must be in a high risk group. Stay safe so we can return to normal next Christmas. Send my love to Mrs. Clause and the elves. Love, M"

When PJs are Business Casual

I live in NC, we don’t have enough snow days.

Cartoon by Chris Lysy
"Every year I would look forward to our first snowy day. It was an excuse to just hang out at home in our PJs, not daring the roads to go into the office. But this year it doesn't feel quite the same."

Virtual Snow Day

I loved snow days as a kid in Maryland. And when everything was switching to virtual, the idea of snow not stopping school just sounded wrong.

Cartoon by Chris Lysy
"Dad, how many inches of snow does it take to shut down the internet? I want a snow day."

Comics from 2018

We all know why the grinch really hated Christmas.

Did you know that It’s a Wonderful Life is an evaluation story?

What is the true impact of Christmas?

Alexa at Christmas

If Charlie Brown were an Evaluator

Comics from 2017

But what are our goals here?

The meaning we get from the holiday season relies almost entirely on our expectations and the context within which we live.  Maybe we just need the right goal.

Christmas is about money.

For some people and businesses, Christmas is a prime commercial opportunity. No matter how many TV Christmas specials try to counter this theme, we live in a time where decorations start going up in storefront windows around halloween.

And not because the shopping centers are just full of the holiday spirit.

Christmas is about making a political statement.

Until recently, wishing merriment around Christmas was mostly just a kind thing to do.

Happy Holidays, the thing we say when we don’t know whether the person we are talking to celebrates Christmas, is seen as a counter argument to Merry Christmas.  Making every greeting a political statement.

Christmas is about spending time with family.

For many of us, the holidays are about spending time together with your small family, big family, extended family, or family of friends.  Depending on who you are, and the family you celebrate with, this could be a hugely positive thing or one filled with obligation and dread.  And maybe it’s both.

Christmas is about giving.

Whether it’s gifts, money, or time, Christmas is a season that puts people in a giving mood.  Yes, if you so choose, Christmas can totally be about presents.

Comics from 2016

A little stats humor.

img_3266

A randomista Christmas?img_3267

Holiday retrofitting.

img_3265

The right gift for that person who has everything.

img_3261

Keep Christmas Funded!

img_3262

Yes, I am creeped out by the Elf on the Shelf, why do you ask?

img_3263

Children with Her

img_3264

Black Friday Inflationimg_2496

Target Audience = Santaimg_2497

It’s the outcomes that matter.img_2498

Some clients from Christmas

Dear Santa, can you send me a few clients for Christmas

Comics from 2014

This kind of cartoon post happens when you’re writing about data visualization in front of a Christmas tree.

An Infographic to Santa

Santa infographic cartoon by Chris Lysy

Santa’s naughty list dashboard

Santa's interactive dashboard cartoon by Chris Lysy

Dataviz Sweater Party

At the dataviz expert ugly sweater party cartoon by Chris Lysy

Comics from 2013

Comics from the Early Years (Dates Unknown)

Rudolph and Herbie just a couple of misfits

This one is from my Redbubble shop, I created it years ago 🙂

Bonus: An Evaluation Christmas Carol (2016)

Evan Scott’s day started just like most other days.

At his desk, staring at a clogged email inbox and a stack of papers filled with things that somehow or another needed his attention.

If he had known just how much paperwork was involved he might have ignored his desires to devote a career towards helping others.

bah-humbug

Suddenly there was a knock at the door.

“Evan, you busy?”

It was his second in command, Bo Cratchet.  She had been with him when he was first pushing the idea for this grant funded non-profit.  Now as project manager she knew much more about the project than he did.

“Yes Bo, always busy, but what can I do for you?”

Bo looked a little sheepish, she had something to say but knew it wouldn’t go over well.

“There are a couple of dashboard developers here.  They’re close friends with my best project assistant and have a few ideas on how we can improve our data collection and analysis.”

Evaluation again.

Didn’t Bo see the stack of papers on Evan’s desk?  She knew the deadlines they were up against better than anyone.  Who has time for evaluation!

Bo didn’t wait for an answer, seeing Evan’s face she quickly changed the topic.

“Justine Marley’s also here.  She said she knows you, should I send her in?”

Evan nodded.

With that Bo turned, closed the door, and headed back out to the main office.

justine-marley

Evan hadn’t seen Justine for years.  He met her as he was just getting started on his grant proposal, Justine was at the time in the final year of her grant.

“Evan, I’m here to warn you.”

“Warn me, about what?”

“It’s your funding Evan, you’re at risk of losing it and everything you’ve built here if you don’t take your evaluation more seriously.”

“But it’s only year two, there are still three years, that’s plenty of time to worry about evaluation.”

Justine, nodded.

“I thought that too Evan, but trust me, it’s not as long as you think.  And the longer you wait, the harder it gets to actually collect accurate data and analyze it appropriately.”

***

That night as Evan Scott readied himself for bed, he couldn’t help but think about Justine’s warning.  “What if she was right?”

“Bah humbug he thought, there’s still time.”

Closing his eyes Evan drifted off to sleep.

***

*Crash*

“What was that,” Evan jumped out of bed.

All of a sudden a figured emerged into his room.

“Hello Evan, I am the spirit of evaluation past.  I am here to show you what was.”

With that the spirit whisked Evan away to a moment in time that seemed like ages ago.  There he was, sitting at a table alongside Professor Fizziwig.

“Why it’s our initial evaluation planning session, and there is old Professor Fizziwig.  He was one of the most influential figures in our initial project design.  He helped us develop a plan that was systematic, outcome-based, and measurable.” Evan remembered the wisdom of the old professor fondly.

“You were so filled with hope and optimism at that time in your program’s development.  But what happened to that evaluation plan?  The moment you hit the least bit of resistance it was abandoned.  You didn’t even bother to call Professor Fizziwig to see if he could help you adapt the plan for the new realities.”

professor-fizziwig

“Tonight you will be visited by two more spirits.  Listen to them Evan, your program is not yet lost.  There is still hope.”  And with that the spirit was gone.

***

The next spirit who arrived introduced herself as the spirit of evaluation present.

“Come with me Evan.”

The spirit took Evan to a small board room.  Crowded around the table were some of the most important figures in the local community.

In front of the room was a young man, presenting in front of a power point deck.

“Spirit, who is that young man?”

“Why it’s tiny Jim, Bo Cratchet’s favorite project assistant.  He has recently taken on the role of evaluator.”

“But what is it that he’s presenting?  It’s a small chart with hardly any data?”

“But don’t you remember Evan.  You haven’t committed the resources towards any type of evaluation.  Poor Evan has meetings like this on a regular basis.  Trying to justify the importance of the program without anything to support his claims.”

“He believes in your program Evan.  He knows it works, but try telling that to this room.  They will only trust the gut of a program assistant for so long.”

tiny-jim

***

All of a sudden the spirit of evaluation present was gone.

In walked another spirit, “hello Evan, I am the spirit of evaluation future.  Let me show you the mark you’ve made on the community.  At least if things keep going as they have.”

The spirit transported Evan to the location of one of his program’s top sites.

But the site was empty, a closed sign hanging on the door.

“Where is everyone spirit?”

“They are gone.  Your program lost its funding, there is nothing for them here anymore.”

“Bo Cratchet?  Tiny Jim? What has happened to them?”

“Looking for new work I’m afraid.  Tiny Jim is considering law school or business school.  His time as a project assistant was tough, he’s decided to move away from the nonprofit sector.”

“And the program itself, has it spun off into a new implementation elsewhere?”

“I’m afraid not.  There was no good evaluation data to prove that it worked.  The lessons learned were inadequately disseminated in long reports that nobody will bother to read.  It’s as if your project never existed.”

it-is-gone

“No spirit!  Say there is still time, we can show the program’s impact.”

We can at the very least share all of the hard lessons we have learned over time!

Please spirit!”

“Oh Evan, the future is always shifting and still very much open for you to alter.”

still-time

Luckily it was all just a dream.

Written by cplysy · Categorized: freshspectrum

Dec 08 2023

One Pager FAQ

Do you know how to design a good one page report? Do you know how many words fit nicely on a single page? Do you want to know how to find good one pager templates? This post is for you!

Cartoon with two elves talking.
Elf 1: "I can't believe you fit Santa's entire list onto a single one pager."
Elf 2: "The font requires a cryogenic transmission electron microscope to read. But yes, it's all there."

How many words fit nicely on a single one page report?

So this one depends a lot on your font choice and size. It also depends on the overall design composition. But let’s test out a few options.

Here is a simple two column design (main column + sidebar). I used Open Sans for the font and left space for an image in the top left. Each of the main Lorem Ipsum paragraphs is 50 words, and the headers are each 8 words.

With a 12pt main body font, 24pt header 1, and 18pt header 2, we get a total of 366 words. This is what it looks like.

One pager example with 12pt font.

If we drop the font sizes to 11pt body, 20pt header 1, and 18pt header 2, we get a total of 441 words. So an increase of about 25%.

One pager example with 11pt font.

If we drop the font sizes to 10pt body, 20pt header 1, and 16pt header 2, we get a total of 541 words. Yes, the words fit, but this one pager feels so much heavier than the 12pt one pager.

One pager example with 10pt font.

Chances are, you’ll want to mix and match just a little. In this one pager I shifted the header 1 over the image, using the same 24pt font as the first example. I used 18pt for the header 2. For the narrative I mixed font size, with the first paragraph of the body text at 12pt and the remaining 4 at 11 pt. I also added a footer block at 11pt.

Now for the sidebar, I dropped the text size down to 10pt and added some images to split the blocks. The change means being more intentional in the writing, but it also increases the word count compared to just dropping the font size.

One pager example with mixed font.

So it wasn’t really my intention originally, but if you like any of these examples, here is the Canva template link. Just make sure to sign into, or register for, Canva before clicking the template link. It’s free.

One pager Canva template.

How do I design a good one-pager in Canva?

Designing for a one pager introduces constraints on your process. Which can actually be a good thing for a designer. Here are two tips that can make designing a one pager a bit easier.

Tip 1. Use Templates.

Canva has a bunch of report templates. The trick is to understand that a report template will show up as just the title page, but there are a bunch that have internal pages designed as well. These internal pages can make for really nice easy to use one pager templates. Like check out the inside spreads for this SDG Progress Report template.

Screenshot of Canva Report.

Also, don’t limit yourself to looking at only ‘Report Templates.’

For example, the inner pages of many Magazine templates could also make for really nice one pagers.

Screenshot of Canva Magazine spread.

Tip 2. Use Grids.

Grids in Canva elements are actually photo grids. But you can also just them as measurement guides, which is what I do often. I put in a grid, overlay a text box over one of the columns and poof, then delete away the text box.

Screenshot of Canva grid.

This is something I talk more about in my FREE Canva Jumpstart course.

Screenshot of Canva Jumpstart course.

My boss likes using Word for track changes and will not use Canva or PowerPoint.

Here is another piece of advice.

It’s okay to design in one platform and write in another. Actually, it’s often better to write in one platform and design in another.

Design or choose a template with generic text (ex. you could use simple lorem ipsum). Use Canva, or PowerPoint if you prefer. Then use the dummy text to understand how many words will fit inside your one pager.

Now you get to act like a Newspaper editor. You know your target word count. If someone wants to go over that word count (including yourself), make it known that the decision will break the template.

You know the one pager template I shared above. Here is a Google doc worksheet I developed to pair with that template. Feel free to copy this worksheet and use it along with the Canva template. You can also download the worksheet as a Word Docx if that’s a preferred writing tool.

Screenshot of Google Doc One pager Worksheet.

Want to improve your own graphic design skills?

Here are some nice free graphic design guides.

A lot of my interest in grid based design started when I found the work of the late Massimo Vignelli. There are a couple of his works available on the web for free download, and they are well worth the read.

The Vignelli Canon

massimo vignelli canon free pdf graphic design

The famous Italian designer Massimo Vignelli allows us a glimpse of his understanding of good design in this book, its rules and criteria. He uses numerous examples to convey applications in practice – from product design via signaletics and graphic design to Corporate Design. By doing this he is making an important manual available to young designers that in its clarity both in terms of subject matter and visually is entirely committed to Vignelli’s modern design.

Designed by Massimo Vignelli, 2009, 96 pages.

FROM RATIONALE DESIGN

Graphic Design for Non-Profit Organizations

rationale resources vignelli non-profit organizations manual cover

The document presented here focuses on improving structural design and general best practices for Non-Profit Organizations. However, the scope of the teachings apply to achieving good design across any industry. These works are the property of their respective owners and should be used for non-commercial research and education purposes only.

Designed by Massimo Vignelli & Peter Laundy in partnership with AIGA, 1980, 52 pages.

FROM RATIONALE DESIGN

Written by cplysy · Categorized: freshspectrum

Nov 29 2023

Canva Jumpstart

Interested in learning how to use Canva but don’t know where to start? Start here.

My Canva Jumpstart Course is now FREE.

I had originally planned to sell this course for more than $200. But since Canva has become such an essential tool in how I approach and teach reporting here on this blog, I’ve decided to make the course free. With no strings attached.

My goal is to give you quick run through on everything you need to know to create professional graphics, infographics, presentations, reports, and videos using Canva.

You don’t need to spend hundreds of dollars on design software to create professional graphics and reports. Trust me, as an information designer I have subscriptions and licenses for A LOT of professional design tools. But project after project I still find myself using Canva more than any other piece of software.

Canva can…

  • help you create better designs, faster.
  • simplify your design workflow.
  • improve your design collaborations.
  • make you look like a design pro, even if you’re not.

This course will introduce the software features, provide you with practical walkthroughs, offer practice exercises, and a set of templates you can adapt and make your own.

Canva Jumpstart Course Curriculum

Module 1: Getting Started (~20 minutes)

In this module you’ll learn the basics. I’ll walk you through some of the basic features and we’ll end with a simple practical walk through by creating a social media graphic together.

  • Why Canva? (1:50)
  • The Canva Mindset (2:44)
  • Essential Features (7:24)
  • A Note about Canva Pro (0:55)
  • PRACTICAL: Creating a Social Media Graphic (8:24)

Module 2: Going Deeper (~40 minutes)

Now that you know the basics, we’ll go a little bit deeper. I’ll walk you through all the different elements and some of the secondary features that get a little hidden by the interface. This section also includes a few practical examples along with a couple of templates.

  • Going Deeper with Canva Design (0:46)
  • Search, Photos, Graphics, Text, Shapes, Colors, Lines, and Grids (11:18)
  • PRACTICAL: Creating a One-Pager from Scratch (5:23)
  • One-Pager Template
  • Frames, Backgrounds, Charts, Tables, Text Effects, Photo Filters (6:54)
  • PRACTICAL: Redesigning a Social Media Chart Post (6:31)
  • Social Media Chart Post Template
  • Animate, Transparency, Grouping, Uploads, Videos, Audio (6:26)
  • PRACTICAL: Designing a YouTube Video (6:19)

How to register?

Registration is easy, just visit the course page by following this link. Then click on “Enroll in Course for FREE” and follow the instructions.

Written by cplysy · Categorized: freshspectrum

Nov 15 2023

One Page Dissemination Plan

Dissemination should be easy.

It’s just sharing our findings and ideas with people who we think might be interested. If it’s hard, it’s because we make it hard.

Let’s make it easy instead.

The One Page Dissemination Plan

At the bottom of this post you’ll find both a link to a Canva template and fillable PDF. It’s landscape, 8.5 in by 11 in.

How to use the plan.

In short, you break your different audiences into three groups. Then for each audience group, you ask who is in the audience, decide what product you will create to reach them, and then jot down how you will share that product.

This is a content strategy plan.

What does that mean? It means that you adapt your work into different pieces of content with the intention of reaching different audiences or communicating through different channels.

You can think of it as report diversification. A printable executive summary might be great for the next board meeting. But it would not make sense to share that PDF executive summary on LinkedIn. It would make far more sense to adapt that summary into a social media carousel.

Adaptation creates more opportunities to share, without diluting or distorting original work designed to be more technical.

This should NOT include your technical report.

I suggest treating your technical report as the product of your evaluation. It documents your methods, defends your decisions, and delivers your analysis.

While a technical report is often a key source in support of your dissemination efforts, it is a mistake to treat the technical report as if it’s easy to share content. It’s probably not. And honestly, it’s also not worth the time it takes to make it easy to share content.

The three audience approach.

Perhaps you’ve gone through the step of thinking through your reporting audiences. And if you’re like many evaluators and researchers, you might even have a list of audiences.

The audiences might include your boss, your boss’ boss, a non-profit board, program managers, program staff, participants, clients, politicians, funders, etc.

It’s hard to design for a list. It’s also overwhelming and time-intensive to design reports for each audience individually. So I suggest splitting your audience into three.

Who is in your Core Audience?

These are the people who would feel compelled to read your report even if it were ugly, long, and boring.

It’s a small group. It likely includes your boss or your client. It might include a few other highly involved stakeholders or board members.

Designing for this group is about making the technical more approachable. Normal reporting content like executive summaries, one-pagers, and presentations usually work just fine.

How will you share the work? Probably through an email from your personal account. Or maybe through a Zoom meeting or an actual in-person get together.

Who is in your Primary Audience?

I like to think of your primary audience being the people who could get the most value from you sharing your work. This might include program managers, project staff, politicians, and funders. Compared to the core audience, they will not be compelled to read your report.

Designing for this group is about making the technical report more relevant and accessible. All audiences are overwhelmed right now so you need to make the reporting as easy to access as possible.

Some of the reporting content that works particularly well for this audience includes visual reports, case studies, slidedocs, blog posts, infographics, video, interactives, html reports, and webinars.

You may have direct emails (if you do, use them). If you don’t have their emails you’ll have to use social media, search-friendly content, and referrals. By referrals I mean gaining access to spaces where the target audience already has a relationship. For instance, a partner organization that already sends a newsletter to the people you want to reach.

Who is in your Secondary Audience?

I like to think of your secondary audience as being people who may have an interest in your work, but it’s not necessarily clear-cut. Or they may have an interest in just a very specific aspect of your work.

These are your “general public” audiences but could also include program participants, families, and academic colleagues.

You likely do NOT have a direct path to reach this audience. Reaching these audiences means leveraging social media, search-friendly content, and referrals. Small infographics, short videos, and targeted social media can help your work travel to these secondary audiences.

3 Audiences, 3 Questions, and 9 individual blocks.

You can access the Canva template below (just make sure to sign up for Canva/sign into your Canva account first). You can fill it in online or print it out. It’s also simple enough to just draw the grid on a whiteboard or piece of paper.

Or, if you prefer a fillable PDF, here you go!

One-Page-Dissemination-Plan-FillableDownload

Good luck. And if you use it or plan to use it, let me know.

Written by cplysy · Categorized: freshspectrum

  • « Go to Previous Page
  • Go to page 1
  • Interim pages omitted …
  • Go to page 12
  • Go to page 13
  • Go to page 14
  • Go to page 15
  • Go to page 16
  • Interim pages omitted …
  • Go to page 54
  • Go to Next Page »

Footer

Follow our Work

The easiest way to stay connected to our work is to join our newsletter. You’ll get updates on projects, learn about new events, and hear stories from those evaluators whom the field continues to actively exclude and erase.

Get Updates

Want to take further action or join a pod? Click here to learn more.

Copyright © 2026 · The May 13 Group · Log in

en English
af Afrikaanssq Shqipam አማርኛar العربيةhy Հայերենaz Azərbaycan dilieu Euskarabe Беларуская моваbn বাংলাbs Bosanskibg Българскиca Catalàceb Cebuanony Chichewazh-CN 简体中文zh-TW 繁體中文co Corsuhr Hrvatskics Čeština‎da Dansknl Nederlandsen Englisheo Esperantoet Eestitl Filipinofi Suomifr Françaisfy Fryskgl Galegoka ქართულიde Deutschel Ελληνικάgu ગુજરાતીht Kreyol ayisyenha Harshen Hausahaw Ōlelo Hawaiʻiiw עִבְרִיתhi हिन्दीhmn Hmonghu Magyaris Íslenskaig Igboid Bahasa Indonesiaga Gaeilgeit Italianoja 日本語jw Basa Jawakn ಕನ್ನಡkk Қазақ тіліkm ភាសាខ្មែរko 한국어ku كوردی‎ky Кыргызчаlo ພາສາລາວla Latinlv Latviešu valodalt Lietuvių kalbalb Lëtzebuergeschmk Македонски јазикmg Malagasyms Bahasa Melayuml മലയാളംmt Maltesemi Te Reo Māorimr मराठीmn Монголmy ဗမာစာne नेपालीno Norsk bokmålps پښتوfa فارسیpl Polskipt Portuguêspa ਪੰਜਾਬੀro Românăru Русскийsm Samoangd Gàidhligsr Српски језикst Sesothosn Shonasd سنڌيsi සිංහලsk Slovenčinasl Slovenščinaso Afsoomaalies Españolsu Basa Sundasw Kiswahilisv Svenskatg Тоҷикӣta தமிழ்te తెలుగుth ไทยtr Türkçeuk Українськаur اردوuz O‘zbekchavi Tiếng Việtcy Cymraegxh isiXhosayi יידישyo Yorùbázu Zulu