• Skip to main content
  • Skip to footer
  • Home

The May 13 Group

the next day for evaluation

  • Get Involved
  • Our Work
  • About Us
You are here: Home / Archives for allblogs / freshspectrum

freshspectrum

Nov 07 2023

3 Common Report Mistakes that Waste Data

Have you ever heard of the last mile problem?

It’s a concept that gets talked about a lot in discussions about supply chains and transportation services. But I also believe it applies to evaluation.

The general idea is that the last leg of a journey is the most complex. For instance, in areas with good transportation networks, it could be pretty easy to get a person from a city center by subway to an area nearish their home. But getting them that last mile (from the station to their home) is the most complicated, and often the most expensive, part.

The biggest challenge I see in evaluation and research is that we do tons of work to get our evidence close to our audience. But instead of dealing with the complex last mile problem, we just give up and move on to the next problem.

It’s a waste of data.

And it’s that waste that has driven my career for more than the last decade.

But let’s break down the last mile problem a bit further. Here are three reporting mistakes that I see over and over and over again. They are mistakes that stop our data and evidence from reaching our intended audience. Each of these problems CAN be fixed.

Mistake #1 – The Single Report Problem.

Here is the mistake.

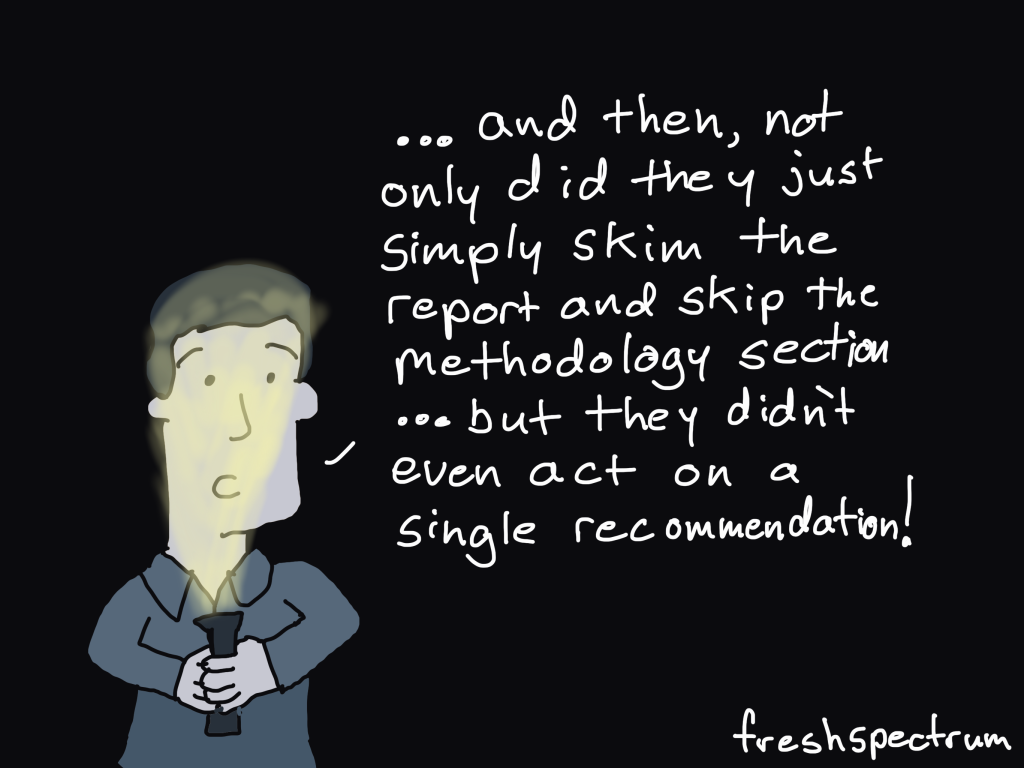
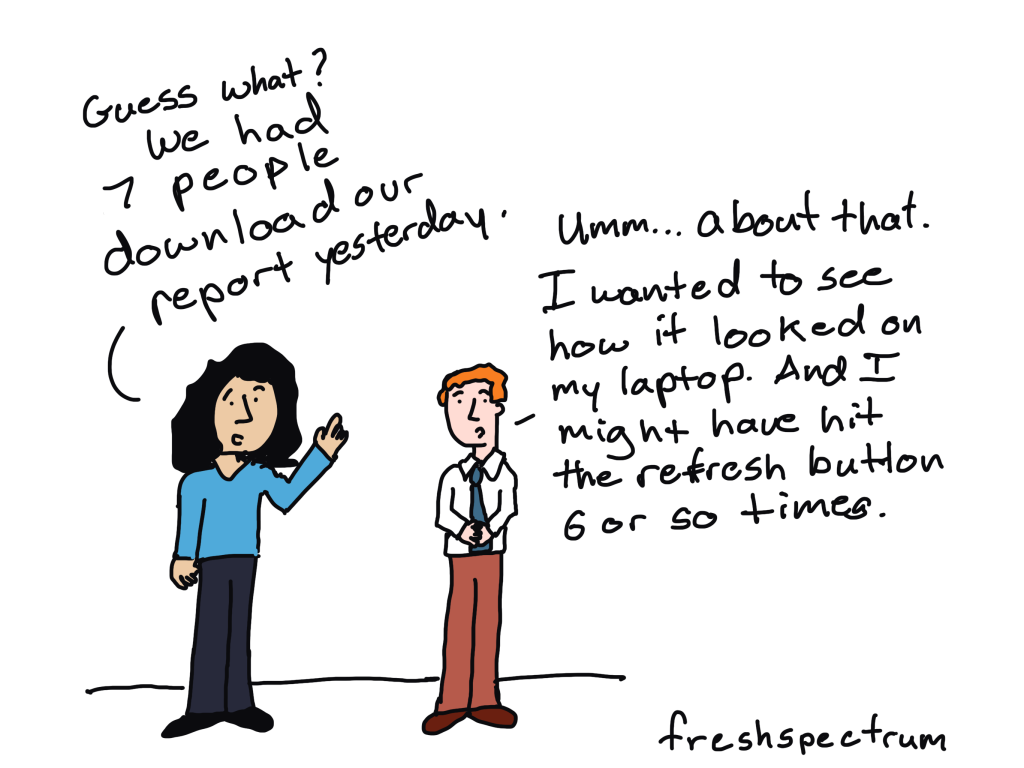
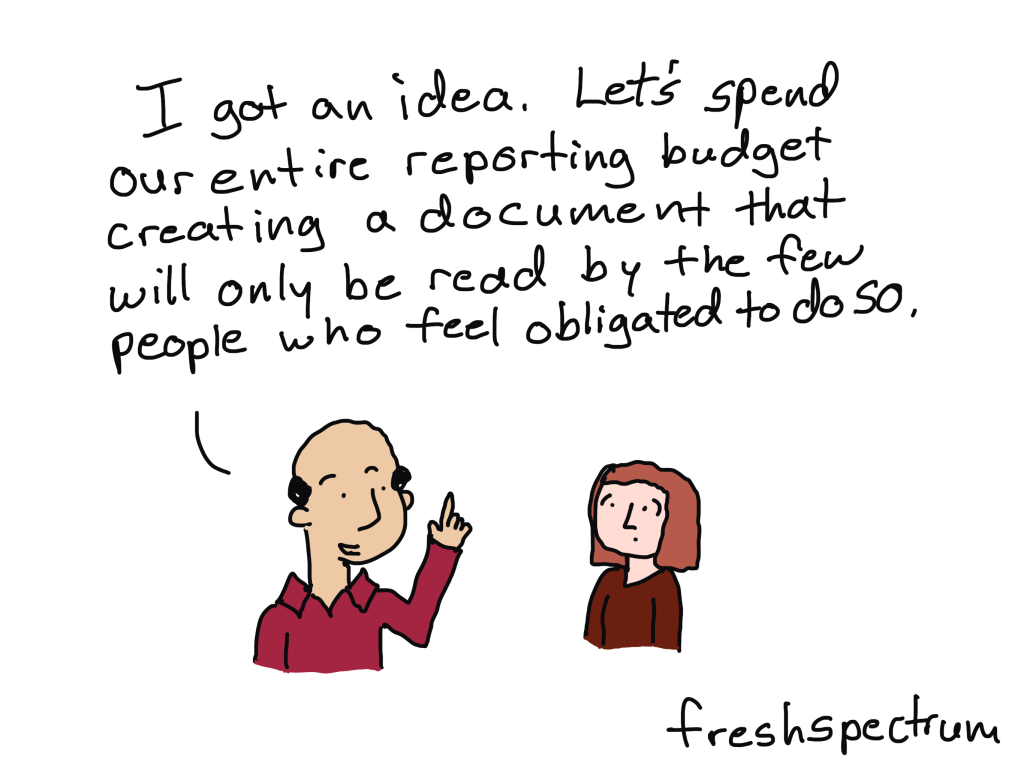
The evaluation team completes their evaluation and delivers a comprehensive technical report to their client. The assumption then is that the client will be able to process the findings and then further distribute these findings.

What happens is that the handful of people who feel obligated to read the report will do so. Whether they act on any findings or recommendations depends on their ability to process the information shared and their motivation to share it forward.

Sharing it forward is the last mile. It requires adapting the materials to meet the needs of various audiences and communication channels. It takes work and a person who has the ability to translate the knowledge from the technical report to meet the needs of these different audiences.

The people in the best position to do the translation are on the evaluation or research team. But by the time it comes to share these findings, many have already moved on.

My Solution: Every technical report should be adapted into a collection of digital assets that facilitate sharing data forward. This is a step that should take place after the technical report is complete (or while it is being written).

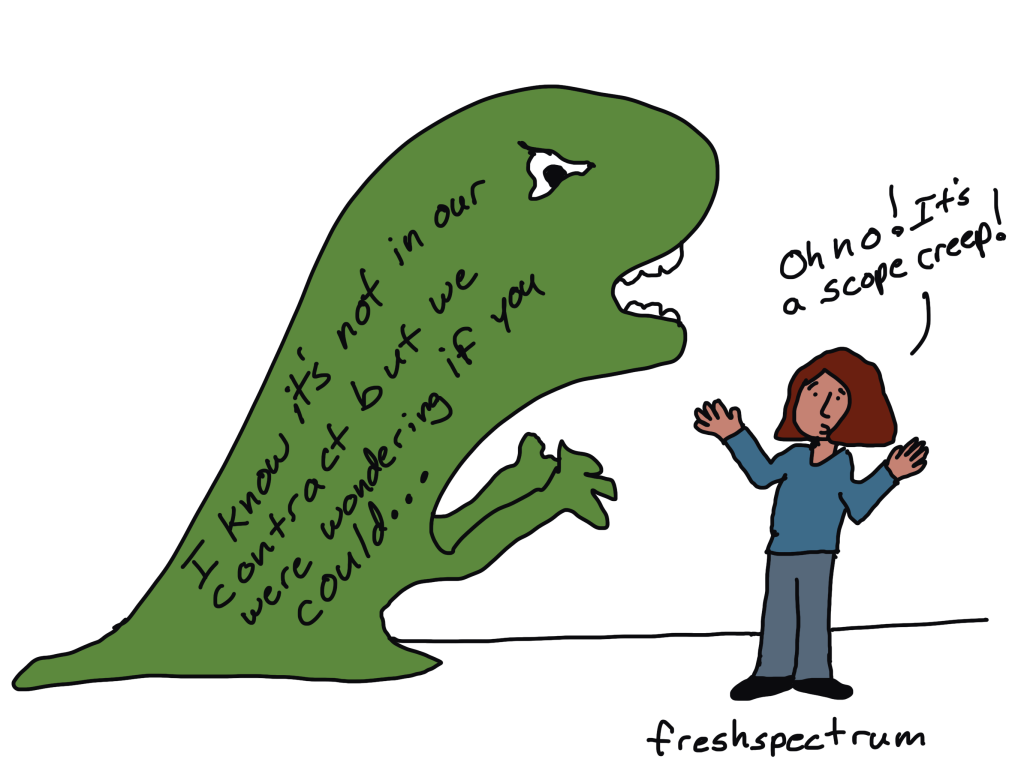
Mistake #2 – The Unintentional Gatekeeper

This happened to me pretty early in my career.

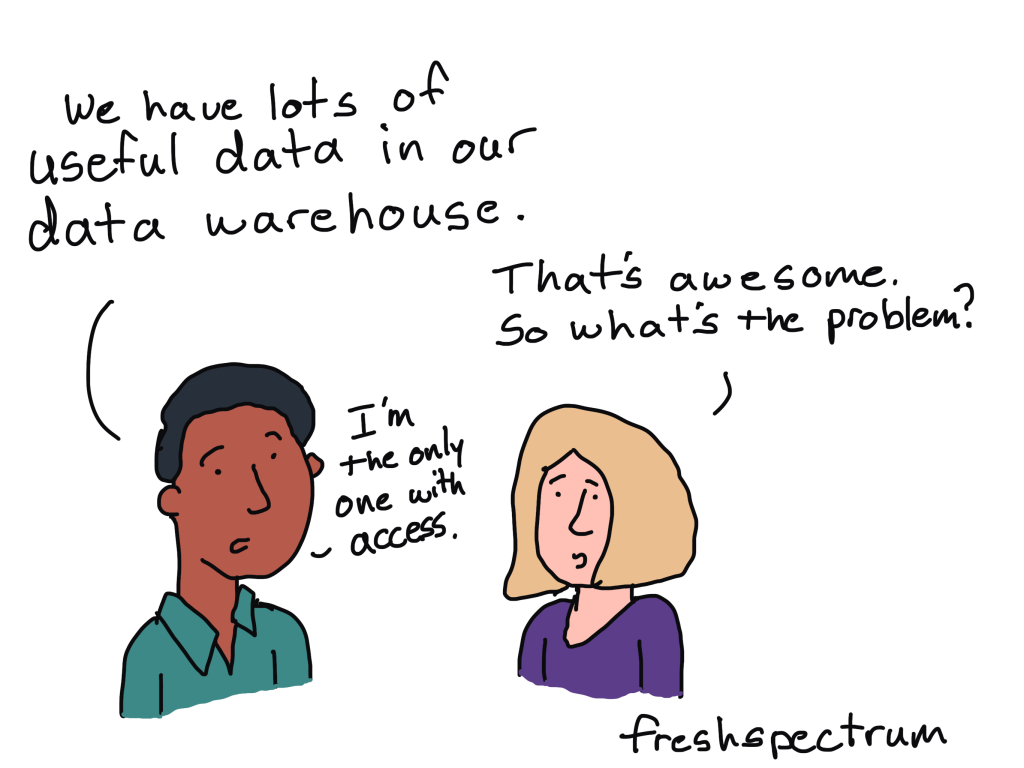
I had a high level of access to different data warehouses and datasets. But the folks working at program sites, who could potentially use this data, did not have the same level of access. And most did not have the same level of experience working with raw datasets.

This happens a lot. Potentially useful data is not shared with broader audiences. And not because there are unsolvable PII issues (Personally Identifiable Information for those not in the know). The reason is that it’s just in the wrong format and stored in the wrong place.

My Solution: Transform datasets and tables into simple dashboards. Not the kind that mimics car dashboards, but the type that sets up larger data sets for stakeholder exploration.

Mistake #3 – The PDF Problem

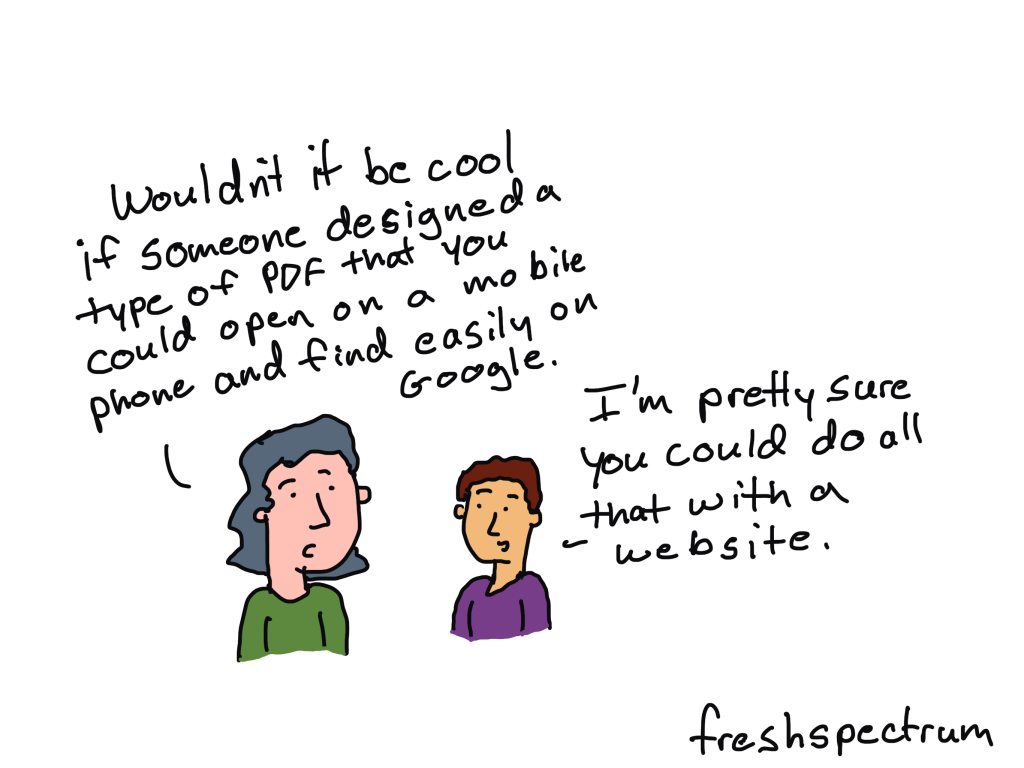
It’s time we move on from exclusively sharing our work through PDF.

Over half of web traffic is mobile these days. PDFs are not mobile responsive.

Google highly prefers HTML web pages to PDFs and will always prioritize non-PDFs in search results. In practice this means that a less useful resource could easily show up higher in search results merely because the alternative was only shared through PDF (the one you created).

PDFs are not auto-translatable. HTML web pages are, and will automatically be translated into over 100 languages just through the use of a modern web browser.

While PDFs have “accessibility features,” a simple HTML website is far easier to make accessible for a wide range of audiences with disabilities.

In other words, PDFs limit access.

My Solution: Adapt the PDF technical report or resource into HTML. I use WordPress.

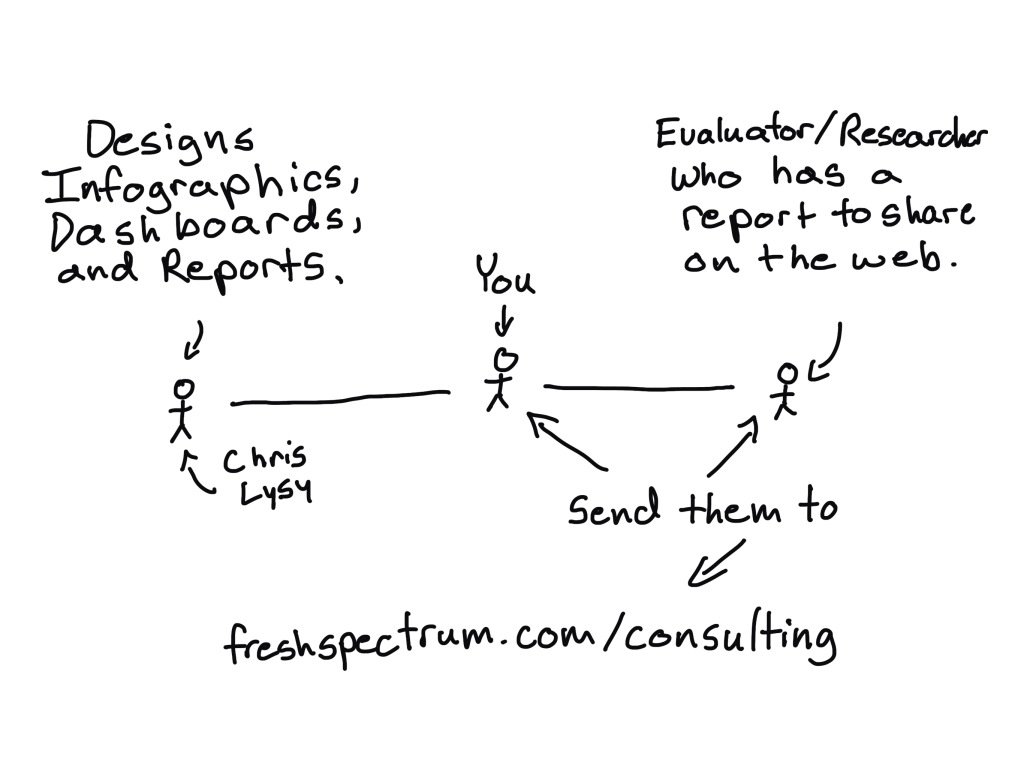
Refer my services, PLEASE!

I’ll be honest. A big multi-year consulting project of mine ended in September.

So, I could really use some new clients to keep my business afloat.

The vast majority of my clients are either direct referrals from the researchers and evaluators who follow my work (I’m talking about people like YOU) or repeat customers.

The post above outlines the key problems I solve and the specific services I pitch. In shorthand, I create infographics, dashboards, and interactive reports for evaluators and researchers.

If you know anyone working on a report who might be able to use my services, could you send them my way?

https://freshspectrum.com/consulting

Written by cplysy · Categorized: freshspectrum

Oct 30 2023

Cartoon Infographic: Inside Big Bird

Comics can really make great infographics. Today’s inspiration was found in the book, Imagination Illustrated: The Jim Henson Journal.

About the Infographic

This is a comic drawn by Caroll Spinney, the performer of Big Bird, as a holiday greeting to his friends. It’s well drawn but also provides a good deal of information.

Here are my favorite parts.

Mixing Fonts and Grid Construction

It’s a comic without frames, but there is definitely some order built in. There are two main columns that break into 4 as you go down the page. It’s not super precise, but as a cartoon it really doesn’t have to be precise.

The mixing of font sizes is purposeful, with narrative and caption based sizes being just a little different. The whole thing feels really well paced.

Inside Big Bird

So there it is, in a single sketch, how big bird was performed. I love how the cartoon doesn’t provide a lot of detail on the human inside, just a dashed outline to show the person with his arm in the air.

There are descriptive annotations, “the head is held as high over my head as I can manage.” But there are also commentary pieces, “Yes, my arm feels like it might ache right off, but that’s part of puppetry tiddletypom!”

There is more detail on the tiny TV monitor and microphone that aid the performance. This is how Big Bird can interact with others.

Under Oscar the Grouch

I love how he pairs the behind the scenes of Oscar right next to Big Bird. You can see how another TV is used behind the scenes, and how his performance of Oscar relates to Big Bird.

“Doing Oscar is fun because he’s just the opposite of Big Bird in personality. I get to let out lots of hostilities.”

As for the drawing itself, Caroll Spinney depicts himself performing Oscar but shows that he’s still wearing his Big Bird legs. All of the puppeteers behind muppets play multiple roles, and this just illustrates that well.

The Anything Muppets

“Here is a group of puppets that can become almost anything! The possibilities are endless.”

Do you ever wonder how they can make so many different types of muppets? Well, this certainly gives you a behind the scene view. In addition to the description we are shown the transformation.

It starts with three base puppet forms. Then we see these puppet forms dressed as characters. Finally, we see these same three puppet forms dressed as entirely different kinds of characters. The transformation quickly illustrates the description.

Bonus: Jim Henson’s design for Big Bird.

This is Jim Henson’s concept sketch.

It’s simple. But it gives enough detail to communicate how the costume should be created and how it would be performed.

Want to check out the book?

I love looking at behind the scenes journals, sketches, and other materials that show the work of creatives. If you do too, definitely find a copy of the book somewhere.

As with most things, you can find the book on Amazon.

Want to dive in deeper?

Here is a conversation with the author Karen Falk.

Written by cplysy · Categorized: freshspectrum

Oct 27 2023

Conflict in Israel & Gaza by the numbers

What happened in Israel on October 7, 2023 was an inexcusable terror attack, as is the current hostage situation. What is currently happening in Gaza is a humanitarian crisis, or rather, a continuation/escalation of a humanitarian crisis.

Both things can be true.

The numbers I share in today’s blog post were pulled from UNRWA situation reports.

How big is the Gaza Strip.

How many internally displaced persons?

What is the population density of the Gaza Strip?

How many people have died in Gaza and Israel since October 7?

The people of Gaza were in bad shape before all of this.

How many UNRWA staff members have been killed in the last couple of weeks?

Just so we are clear.

I am for the most part a pacifist.

The Hamas attack on October 7 was horrendous.

But I don’t see how Israel’s actions, supported by the U.S. government and U.S. tax dollars, will improve anything. I don’t see how any of this doesn’t just lead to more death, destruction, and increased poverty. I don’t see how any of this makes anyone safer, anywhere.

Written by cplysy · Categorized: freshspectrum

Oct 11 2023

Halloween Evaluation Comics 2023

Time for yet another halloween evaluation comic post. Which is your favorite? Let me know in the comments.

Scope Creep

This one inspired by Kasey Valente.

Halloween comic idea- something to do with “scope creep”…. I was writing about scope creep this week and kept visualising creep as a halloween monster of sorts.

Whatever you do, don’t fall asleep.

You kind of need to know a little about Nightmare on Elm Street for this one to make sense. That guy totally gave me nightmares as a kid.

Evaluator Scary Stories.

I almost added a kid saying, “dad, that’s not scary,” to this one. Still not sure I made the right decision leaving it out, but just felt too busy with it in.

Ghosting Participants

Not sure I needed the whole haunted house study thing here. Also, am I giving you too much behind the scenes in my thought process?

Night of the Living Draft

This one inspired by Lisa O’Keeffe.

Re Halloween Cartoons, how about a cartoon highlighting neverending stakeholder feedback and ‘suggestions’ (especially when it is an evaluation report prepared for a government department) and or the head of department/stakeholders in the background steering the findings.

Engaging Stakeholders [From the Archive]

This one is super old from when I first started drawing comics with my first iPad.

Like these? Check out a couple of my old halloween posts.

Here is a post from 2017, it includes one of my all time favorites.

Data Halloween Cartoon Post

Here is my 2020 cartoon post…I was thinking about COVID a lot at the time, but it still has a couple of gems.

Halloween Cartoons 2020 Edition

Written by cplysy · Categorized: freshspectrum

Oct 05 2023

The 3 things you need to become a better data designer (not one is about tech).

Do you want to improve your data visualization design and reporting skills? Stop worrying about technology.

The technology part of data visualization design has gotten easier and easier over the 15 years I’ve been designing and teaching design. If you are driven, with a few hours and a YouTube tutorial or two, you can figure out how to create just about anything.

It also doesn’t have to cost a bunch. Tools I use all the time, like Canva, Flourish, and Datawrapper, offer a ton of value for free.

So what do you actually need to become a better designer?

I believe it’s these three things.

1. Practice

Practice makes you better. This is true for everything, but it’s especially true for most data people hoping to improve their design skills. Most Masters and PhD programs don’t give you a lot of creative practice. Quite the opposite.

If you want to be a better creator, you need to create things.

2. Exposure

You need to know what’s possible. If you want to become a better writer, read more good books. If you want to become a better report designer, experience more good reports.

3. Support

Whether it’s a mentor or peer community, you need other people to turn to when you get stuck. Support is having someone you can ask for help. But it’s also having someone to give you encouragement or see the things in your own work that you are just missing.

DiY Data Design Action Club.

I run a membership community teaching data people how to become better designers. It’s built on the teaching philosophy I laid out in this post.

Yes. I have tutorials. Yes. I have courses. Yes. I have templates.

But none of that stuff really matters.

  • What matters is that you find a way to practice that works for you.
  • What matters is that you get exposure to different designs, reports, and tools.
  • What matters is that you have someone you can ask for help. Preferably someone who inspires and encourages you to find your best creative self.

That’s it. I offer those those things through action club. And if you are interested, and like learning from me, you should consider joining.

Written by cplysy · Categorized: freshspectrum

  • « Go to Previous Page
  • Go to page 1
  • Interim pages omitted …
  • Go to page 13
  • Go to page 14
  • Go to page 15
  • Go to page 16
  • Go to page 17
  • Interim pages omitted …
  • Go to page 54
  • Go to Next Page »

Footer

Follow our Work

The easiest way to stay connected to our work is to join our newsletter. You’ll get updates on projects, learn about new events, and hear stories from those evaluators whom the field continues to actively exclude and erase.

Get Updates

Want to take further action or join a pod? Click here to learn more.

Copyright © 2026 · The May 13 Group · Log in

en English
af Afrikaanssq Shqipam አማርኛar العربيةhy Հայերենaz Azərbaycan dilieu Euskarabe Беларуская моваbn বাংলাbs Bosanskibg Българскиca Catalàceb Cebuanony Chichewazh-CN 简体中文zh-TW 繁體中文co Corsuhr Hrvatskics Čeština‎da Dansknl Nederlandsen Englisheo Esperantoet Eestitl Filipinofi Suomifr Françaisfy Fryskgl Galegoka ქართულიde Deutschel Ελληνικάgu ગુજરાતીht Kreyol ayisyenha Harshen Hausahaw Ōlelo Hawaiʻiiw עִבְרִיתhi हिन्दीhmn Hmonghu Magyaris Íslenskaig Igboid Bahasa Indonesiaga Gaeilgeit Italianoja 日本語jw Basa Jawakn ಕನ್ನಡkk Қазақ тіліkm ភាសាខ្មែរko 한국어ku كوردی‎ky Кыргызчаlo ພາສາລາວla Latinlv Latviešu valodalt Lietuvių kalbalb Lëtzebuergeschmk Македонски јазикmg Malagasyms Bahasa Melayuml മലയാളംmt Maltesemi Te Reo Māorimr मराठीmn Монголmy ဗမာစာne नेपालीno Norsk bokmålps پښتوfa فارسیpl Polskipt Portuguêspa ਪੰਜਾਬੀro Românăru Русскийsm Samoangd Gàidhligsr Српски језикst Sesothosn Shonasd سنڌيsi සිංහලsk Slovenčinasl Slovenščinaso Afsoomaalies Españolsu Basa Sundasw Kiswahilisv Svenskatg Тоҷикӣta தமிழ்te తెలుగుth ไทยtr Türkçeuk Українськаur اردوuz O‘zbekchavi Tiếng Việtcy Cymraegxh isiXhosayi יידישyo Yorùbázu Zulu