• Skip to main content
  • Skip to footer
  • Home

The May 13 Group

the next day for evaluation

  • Get Involved
  • Our Work
  • About Us
You are here: Home / Archives for allblogs / freshspectrum

freshspectrum

Jan 25 2024

3 lessons learned about online courses in early 2024

I launched my first online workshop in late 2015.

I had this idea that it would be best to start, whether or not I had everything ready in advance. And as we went, I would listen to the needs of participants and respond with lessons and activities. It was messy and a bit disorganized.

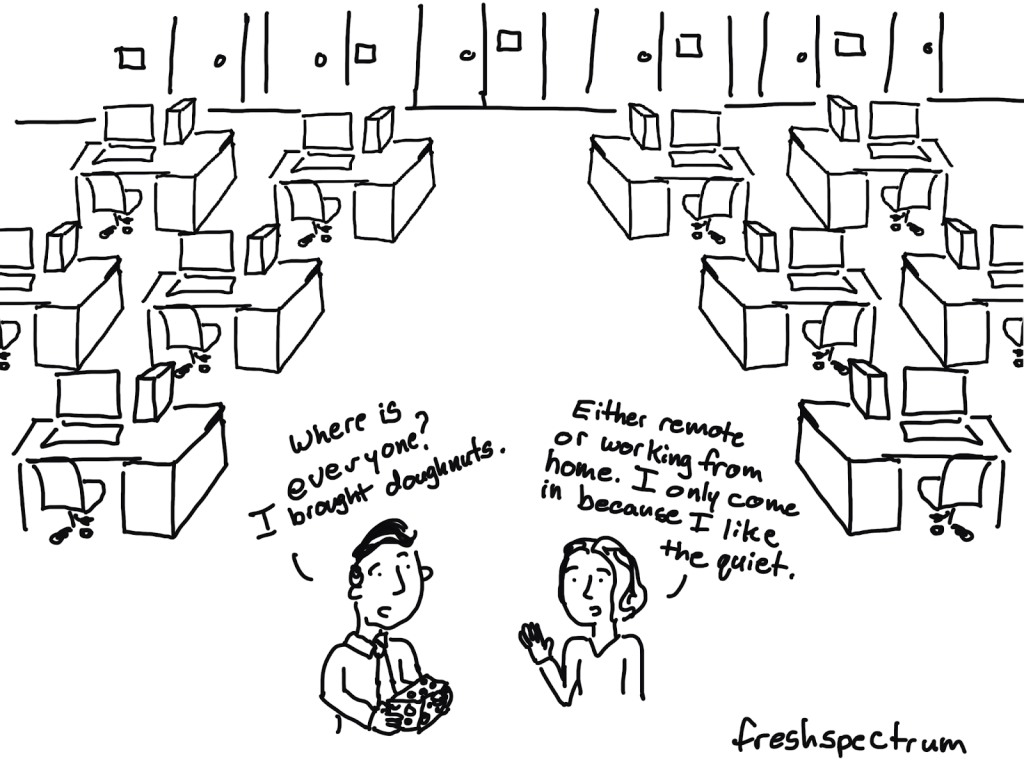
And for awhile, I think that was fine. There wasn’t as much competition or sophisticated easy-to-use learning management software. Most workshops were still very much live in-person events, and simply teaching workshops online was new for many.

But times change. And if we would like to stay relevant, so must we. I’ve spent the last few months exploring changing workshop needs. In today’s post, I’ll share a bit of what I’ve learned.

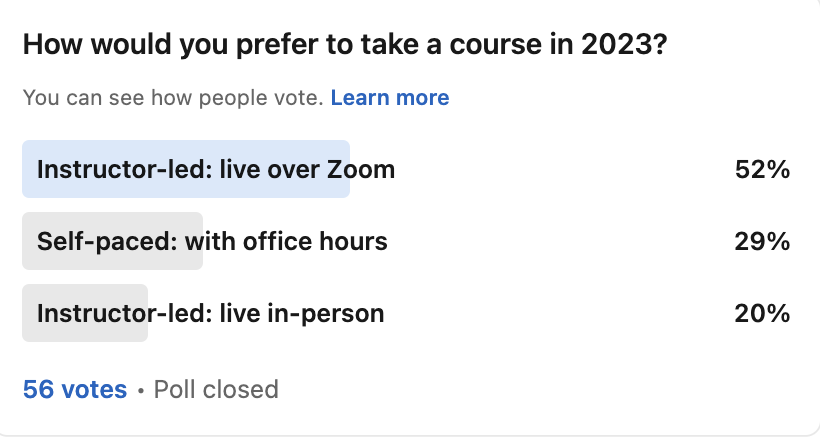
Lesson 1 – For someone with expertise to share, webinars are still the standard.

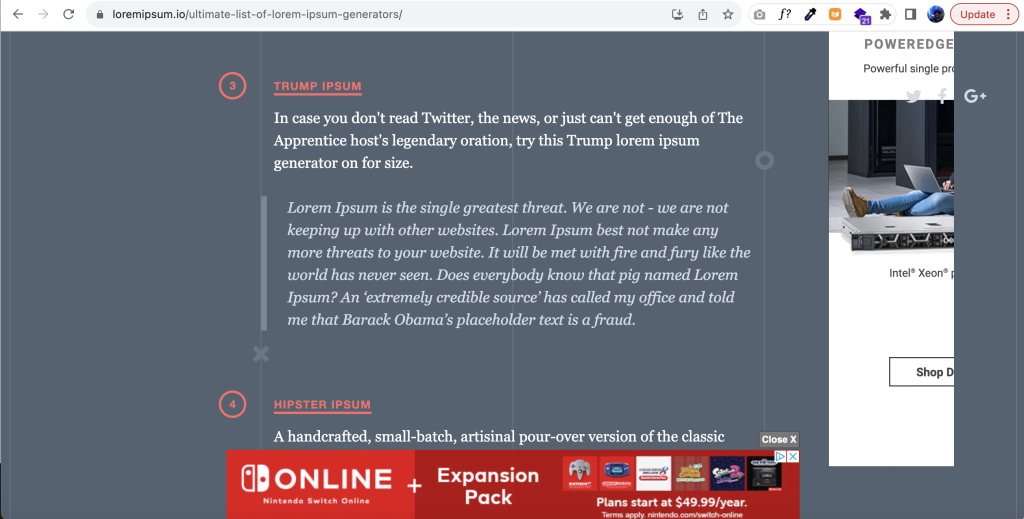
Early days of the web, most virtual trainings in the data world were live webinars. Then, as time progressed, there were more and more opportunities to create and share self-paced courses.

This is certainly what I shifted towards, offering self-paced courses along with live office hours. But whether or not we’ve swung back to a preference for live webinars, or if we never left, there are definitely signs that people want to learn from other people live.

How many times have you signed up for a self-paced course and then never started it? Or thought, I’ll just get back to that later…

Webinars give you a deadline. They make you block off time. And they offer you a live in-person experience with other people.

Lesson 2 – Shorter blocks of time are easier to schedule.

My wife was looking for a creative writing class one day. And the live option she was offered was 3 hours long. Which, for physical issues, was not ideal.

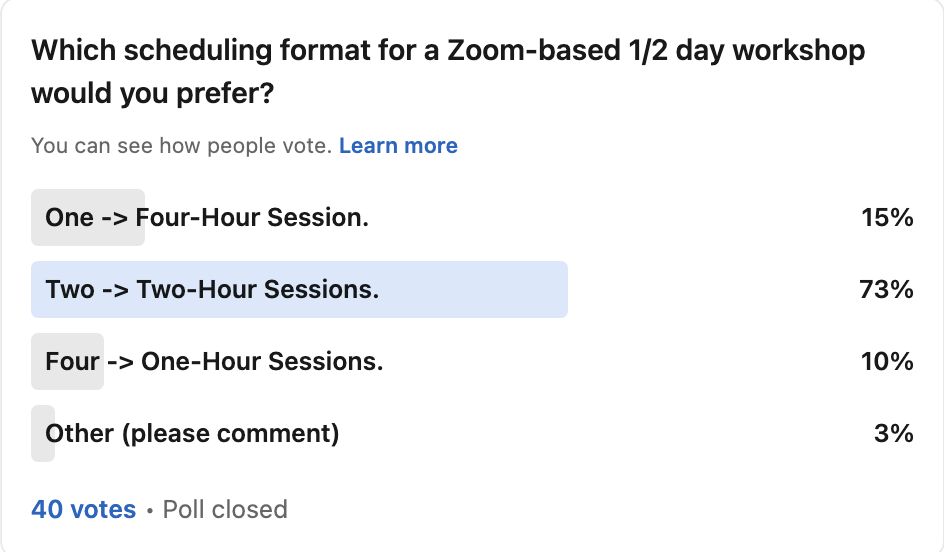
When I asked on LinkedIn whether people would prefer a Zoom based workshop with a longer block of time (get it all done at once) or split into shorter segments (two or four sessions), I felt like I would see an even mix of responses.

Turns out, not really. I think 2 hours is almost some kind of a natural limit (or perhaps 90 minutes) for attending live virtual courses and workshops. It’s easier to schedule a 2 hour block than a 4 hour block, as it doesn’t completely disrupt your entire day. And for some reason two 2-hour sessions just sounds a lot more do-able than four 1-hour sessions.

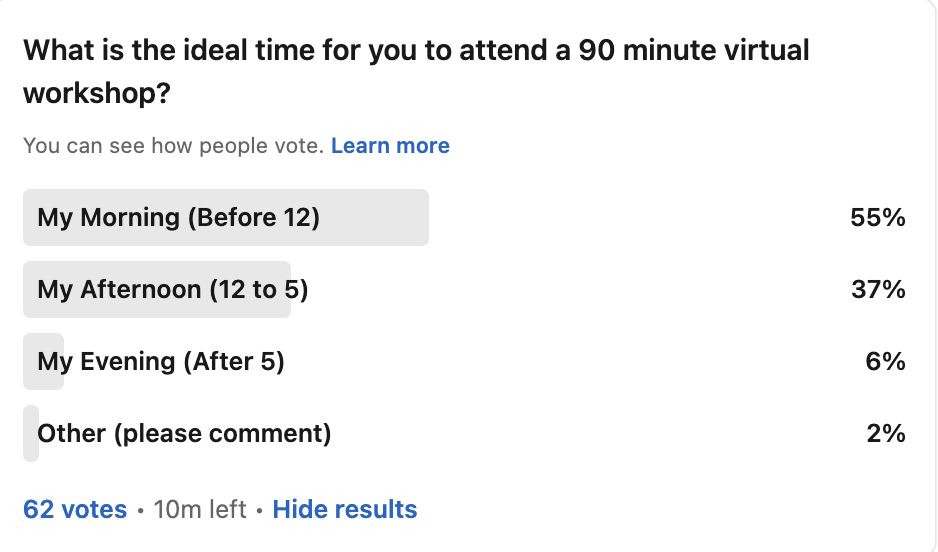
Lesson 3 – Mornings and afternoons are generally the best times to teach.

Timing is always a challenge when you reach a global audience.

Early in the morning on the east coast means super early in the morning on the west coast but it gives Europeans and Africans a chance to attend during their workday. But if you wait till till later in the afternoon, you get to invite evaluators in eastern/south-eastern Asia and the Pacific. Too early and they’ll be sleeping.

Timezones aside, I think most people want to take their courses during a standard workday. And it seems like most of the time, in the morning. I definitely relate to this, I am more ready to learn in the mid-morning as by afternoon I’m usually pretty worn down.

Announcing my next course.

So I’ve decided to teach my next online course live over the Zoom in late February.

I plan to teach live starting at 10AM (my morning). And I’m splitting the half-day workshop into two 90 minute blocks (+30 minutes of optional Q&A time each day for those that want it).

If you’re interested in learning how to design effective visual one pagers, briefs, fact sheets and more, you should consider registering!

Written by cplysy · Categorized: freshspectrum

Jan 16 2024

When Gap Width Doesn’t Work

This video is for all the people commenting “Not Useful” on my video about gap width… I think I found your problem.

The “I don’t feel like watching a video right now,” summary.

In this video, Chris dives deeper into his previous video on removing gaps between bars in Excel charts (https://www.youtube.com/watch?v=wAgjY…), addressing the issue of why the gap width setting sometimes doesn’t work as expected. He explains that the culprit can be hidden blank rows within your data table. Even though these rows don’t have any data, Excel still factors them in as spaces on the chart, creating gaps between the bars.

The solution is simple: remove the blank rows from your data table. Once those are gone, setting the gap width to 0% will truly eliminate the spacing between the bars, achieving the desired effect.

This video serves as a helpful follow-up, clarifying a potential hurdle viewers might encounter when trying to implement the gap width technique. Remember, if you’re still struggling with gaps after removing blank rows, feel free to leave a comment below the video for further assistance.

Written by cplysy · Categorized: freshspectrum

Jan 12 2024

The 5 Minute Skim Test Using Visual Hierarchy to Reach Busy Execs

Struggling to understand reports in 5 minutes? Learn how to design skimmable reports!

Struggling to understand reports in 5 minutes? Learn how to design skimmable reports!

Tired of dense reports you don’t have time to read? This video teaches you how to use visual hierarchy to create reports that are easy to skim and understand, even in a rush.

In this video, you’ll learn:

  • Why traditional reports fail busy readers.
  • The power of visual hierarchy for clear communication.
  • Simple design tricks to make your reports skimmable.
  • Two real-world examples of good and bad report design.

Stop wasting time with confusing reports! ??? Equip yourself with the skills to design visuals that tell a story, even in just a few minutes. ?

Watch now and:

  • Get actionable tips for improving your reports.
  • Learn from practical examples.
  • Make your data presentations truly impactful.

Plus, don’t forget to:

  • Subscribe for more data visualization tips!
  • Check out my free Canva Jumpstart course to take your design skills to the next level.

**Let’s make reports that work for everyone! **

Written by cplysy · Categorized: freshspectrum

Jan 10 2024

Ditch the Text Walls, Embrace the White Space!

Tired of your reports looking like dense, unreadable brick walls? Check out this video with quick tips on why and how to start intentionally including white space in your reports.

Here is a little summary of what you’ll see in the video.

In this video, Chris, of Data Viz Made Easy, delves into the often-overlooked power of white space in report design. He contrasts two reports: the dense, text-heavy layout of the National Center for Education Statistics report with the airy, organized aesthetic of the Gates Foundation report.

By strategically incorporating white space, you can transform your reports from cluttered walls of text to visually appealing and easily digestible documents. Imagine columns of text neatly confined within a grid, charts breaking the monotony, and generous margins framing the content with breathing room. This simple yet effective technique adds a touch of professionalism and makes your reports significantly less overwhelming for readers.

Whether you’re using Word or design software like Canva, Chris provides practical tips on implementing white space. He emphasizes discipline in keeping text within the grid and suggests utilizing grids as measurement tools. Remember, it’s all about balance: text nestled comfortably within white space, like islands in a calm sea.

So, ditch the text jungle and embrace the power of white space. Your reports will thank you, and your readers will be delighted!

Written by cplysy · Categorized: freshspectrum

Jan 04 2024

Design in Canva with Lorem Ipsum

Want some quick report design advice? Don’t wait until you are finished writing your report to design your report.

Seriously, I have been in the data field for two decades working on research and evaluation projects. The vast majority of projects have waited until the very last minute to do any design work. The excuse, “we’re not done writing the report.”

But designing while you write helps you write better. And it helps make the design better. All you need is to add some dummy text (a.k.a. lorem ipsum).

Here are three ways to use Lorem Ipsum in your next Canva design.

1. Use an integrated Canva App

Inside a Canva Design, on the left menu panel, you’ll find an option for Apps. This menu includes a large range of 3rd party applications already integrated with Canva.

In the App search bar, if you type in “Lorem” you will pull up two Apps, both are simple and useful.

The Lorem Ipsum App

The Lorem Ipsum app gives you two entry fields. You put in the number of words and the font size then click generate lorem ipsum.

The app will then generate random a text box with random lorem ipsum text in a Canva Sans font. You can then do whatever you would like with it. If you don’t like the specific text, hit the button again to generate a new text box.

That’s it. That’s the app. Simple, but useful.

The CanLorem App

The CanLorem app is slightly more sophisticated.

You get three tab options. Words, Sentences, and Paragraphs. You also get to see a preview of your lorem ipsum text before you add to your design and can regenerate if you don’t like the specific random text.

And again, that’s it. Another simple, but useful option.

2. Use a web based Lorem Ipsum tool.

Another option, if you don’t like the integrated apps, is to just use a web based generator.

There are a bunch out there, just hit up Google.

But here is one that I like, it can be found at loremipsum.io.

You have the choice to choose generate by number of words, sentences, or paragraphs. Then just hit the copy button and paste it into Canva.

You don’t need to create a text box first. Just right click paste, CTRL “V”, or command “V”, right into your design.

Now, if you are feeling a little more playful, you can choose one of the other Ipsum generators recommended by loremipsum.io.

3. Just copy words from an old report or anything else.

Final option, just copy words from an old report.

Written by cplysy · Categorized: freshspectrum

  • « Go to Previous Page
  • Go to page 1
  • Interim pages omitted …
  • Go to page 11
  • Go to page 12
  • Go to page 13
  • Go to page 14
  • Go to page 15
  • Interim pages omitted …
  • Go to page 54
  • Go to Next Page »

Footer

Follow our Work

The easiest way to stay connected to our work is to join our newsletter. You’ll get updates on projects, learn about new events, and hear stories from those evaluators whom the field continues to actively exclude and erase.

Get Updates

Want to take further action or join a pod? Click here to learn more.

Copyright © 2026 · The May 13 Group · Log in

en English
af Afrikaanssq Shqipam አማርኛar العربيةhy Հայերենaz Azərbaycan dilieu Euskarabe Беларуская моваbn বাংলাbs Bosanskibg Българскиca Catalàceb Cebuanony Chichewazh-CN 简体中文zh-TW 繁體中文co Corsuhr Hrvatskics Čeština‎da Dansknl Nederlandsen Englisheo Esperantoet Eestitl Filipinofi Suomifr Françaisfy Fryskgl Galegoka ქართულიde Deutschel Ελληνικάgu ગુજરાતીht Kreyol ayisyenha Harshen Hausahaw Ōlelo Hawaiʻiiw עִבְרִיתhi हिन्दीhmn Hmonghu Magyaris Íslenskaig Igboid Bahasa Indonesiaga Gaeilgeit Italianoja 日本語jw Basa Jawakn ಕನ್ನಡkk Қазақ тіліkm ភាសាខ្មែរko 한국어ku كوردی‎ky Кыргызчаlo ພາສາລາວla Latinlv Latviešu valodalt Lietuvių kalbalb Lëtzebuergeschmk Македонски јазикmg Malagasyms Bahasa Melayuml മലയാളംmt Maltesemi Te Reo Māorimr मराठीmn Монголmy ဗမာစာne नेपालीno Norsk bokmålps پښتوfa فارسیpl Polskipt Portuguêspa ਪੰਜਾਬੀro Românăru Русскийsm Samoangd Gàidhligsr Српски језикst Sesothosn Shonasd سنڌيsi සිංහලsk Slovenčinasl Slovenščinaso Afsoomaalies Españolsu Basa Sundasw Kiswahilisv Svenskatg Тоҷикӣta தமிழ்te తెలుగుth ไทยtr Türkçeuk Українськаur اردوuz O‘zbekchavi Tiếng Việtcy Cymraegxh isiXhosayi יידישyo Yorùbázu Zulu