• Skip to main content
  • Skip to footer
  • Home

The May 13 Group

the next day for evaluation

  • Get Involved
  • Our Work
  • About Us
You are here: Home / Archives for allblogs

allblogs

Oct 31 2022

How to Write about Research Methods Like a Human (and Not a Textbook)

Did you devote years of your life trying to sound “smart” and “professional,” like a textbook?

I did.

I taught myself how to write in third-person language.

I called myself “The researcher…” instead of plain ol’ “I…”

I replaced my everyday words with “smart” synonyms. I literally paged through my GRE study guide. I tried to use as many GRE vocab words as possible.

Then, I started working in the real world.

My bosses rolled their eyes.

Another one from an academic background, they sighed. We’ll have to re-train her from scratch.

I panicked. But if I wasn’t supposed to sound like a textbook, what was I supposed to sound like???

A human!

It took me years to grasp that simple concept. I’m a person. It’s okay to sound like a person.

Nowadays, I make a living by teaching humans how to sound like humans again.

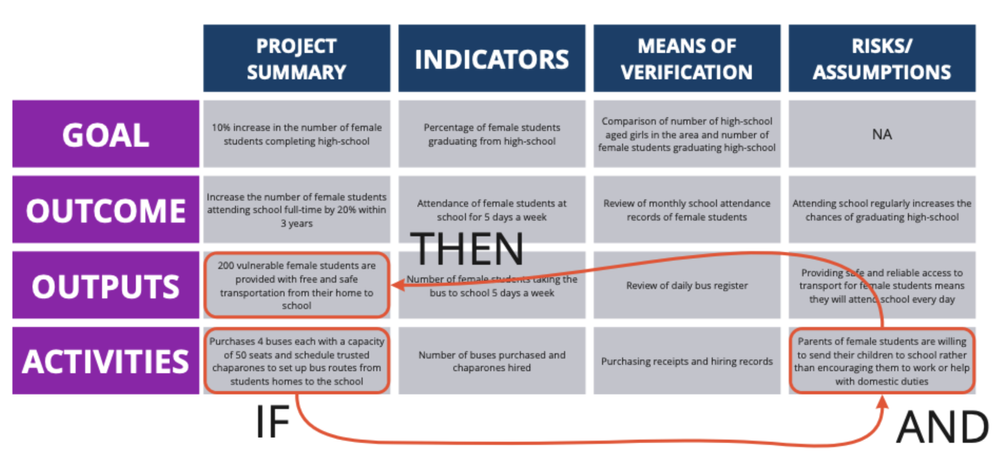
Before/After Makeovers for Common Methodology Sentences

Here are some before/after examples in case you’re still on the textbook-back-to-human journey like I was.

Please please please use these transformations in your technical reports.

I’m not so worried about peer-reviewed journal articles — that’s another battle for another day. Today, I’m focusing on your non-journal writing scenarios.

Who Designed the Survey?

  • Before: A survey instrument was designed by the ABC Research Company working under the supervision of the DEF Foundation staff, and key department heads of GHI Agencies.
  • After: The ABC Research Company, DEF Foundation, and GHI Agency teamed up to collect data.

Who Responded to the Survey?

  • Before: A series of survey instruments were developed to administer among students in the ABC programs.
  • After: We designed surveys to collect information from students in the ABC programs.

How Many Responses?

  • Before: A total of 14 programs participated in the survey.
  • After: Fourteen programs participated in the survey. (Remove redundancies like “a total of.”)

Or…

  • Before: A total of 144 programs participated in the survey.
  • After: We collected surveys from 144 programs. (Because writing out numbers at the beginning of a sentence is the worst.)

When Did You Collect Data?

  • Before: Initial surveys were launched on March 7, 2018 with fieldwork continuing to accommodate the schedules of participating institutions. Data collection was cut off on April 25 to begin data processing. A total of 789 surveys were attempted, with a total of 654 surveys completed sufficiently to include in the final tabulated results. A total of 123 individuals entered their contact information for a drawing.
  • After: We collected surveys in Spring 2018. We tried to collect data from 789 people, and 654 people participated, for a response rate of 83 percent—one of the highest response rates we’ve ever had on a survey.

Referencing the Just-in-Case Tables

  • Before: We are providing detailed data tables with this report that shows the responses by institution.
  • After: Want to view responses by institution? View the appendix on page 31.

Demographics on Respondents

  • Before: Overall, undergraduate students comprise 65% of total responses and graduate students comprise the remaining 35%.
  • After: Two out of three responses (65%) were from undergraduate students. The rest were from graduate students. (Getting rid of the word “comprise.)

Describing the Survey’s Topics

  • Before: One way the important resources and individuals specifically helped at least two-thirds of students were giving them a good sense for the kinds of careers they could pursue with a degree.
  • After: We asked students which resources were most useful. Two out of three students said that others had given them a sense of career options that they could pursue with their degree.

Summarizing the Survey’s Findings

  • Before: The largest mean share of the total cost are paid for by the student or their family, who account for 50% of the total cost. Student loans are used to cover a mean of 20% of the total cost, and scholarships or other financial aid pay for 30%.
  • After: For the typical student, 50% of their costs are covered by the student and their family, 30% are covered by scholarships or financial aid, and 20% are covered by student loans. (Getting rid of awkward language like “mean share” and “account for.”)

Objectively Scoring the Before/After Translations

In my gut, I know the translations are easier to read.

Let’s objectively test them.

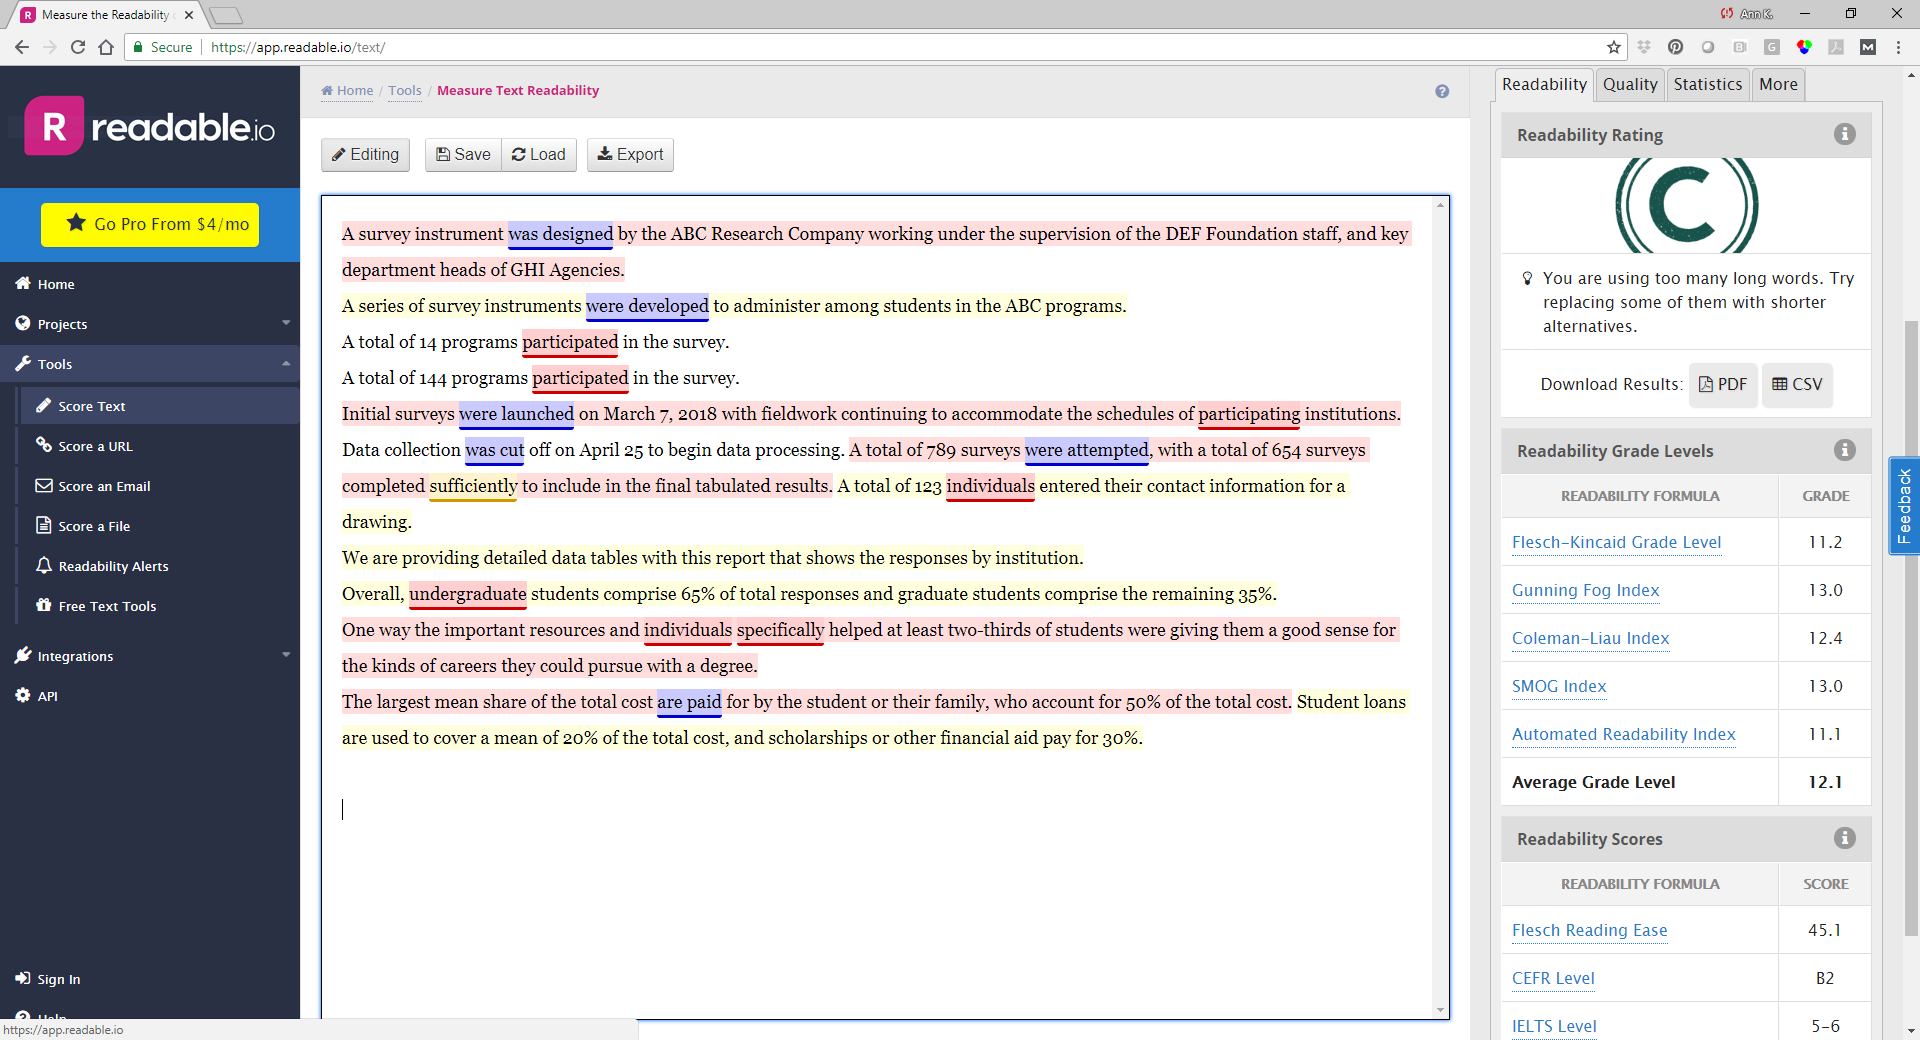
Before: 12.1 Grade Level

The human-trying-to-sound-like-a-textbook wrote at a 12.1 grade level.

Okay, that’s not the worst I’ve seen.

The highest I’ve seen is a 36 (from a team of Ph.D. psychologists).

Can you beat a 36??? Let me know if you find any contenders. I’d love to (try to) read it.

(This screenshot is from Readable.com, which used to be a free reading level checker. It looks like they require payments nowadays, but there are plenty of free- and low-cost tools. Like good ol’ Microsoft Word! Comment below if you’ve got a favorite.)
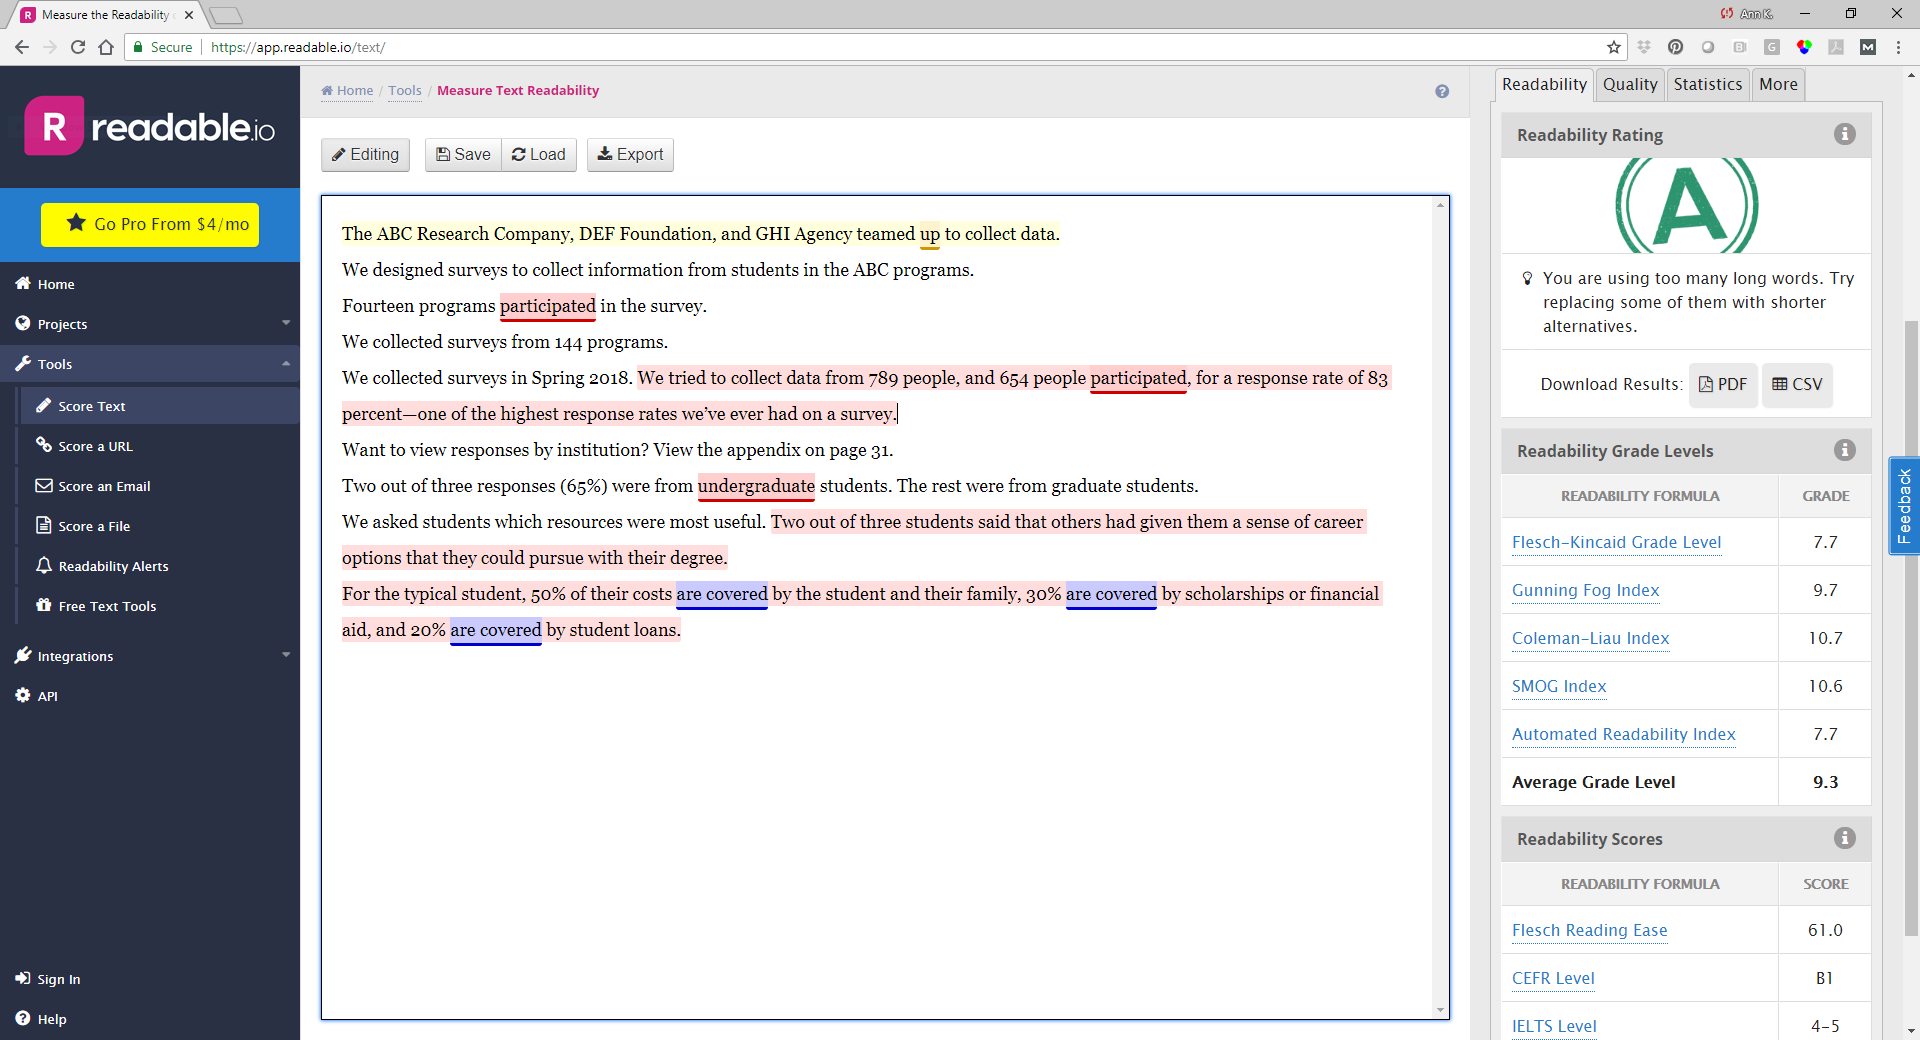
A­fter: 9.3 Grade Level

I personally aim for grade level 6 to 8—throughout my blog posts, books, and even contracts.

I didn’t quite reach my goal. But a 9.3 isn’t horrible, either. The Readable site gives this an “A!”

Higher is not better. Lower is better.

You are a human who’s writing for humans. You are not a textbook. You are not a textbook. You are not a textbook. You are not a textbook.

How to Lower the Reading Grade Level

Try one (or more!) of these techniques:

  • Shorten the sentences. An easy fix is to look at your longest sentences. Replace your commas with periods (i.e., break one long sentence into two shorter sentences).
  • Shorten the paragraphs. Press the “enter” key lots and lots and lots.
  • Use first-person language. Adjust the sentence structure. Change “A survey was administered…” to “The agency administered a survey” or “We administered a survey.”
  • Find synonyms. This is the hardest one for me. What’s an accurate, understandable translation of calculations like standard deviation or confidence interval??? I used to pack those terms into the report’s body and hope for the best. What happened? Lots of Dusty Shelf Reports! Nowadays, I follow the 30-3-1 Approach to Reporting. I keep the methods section in the report’s body as short as possible, and I tell readers to check the appendix for more info. I don’t care if the appendix is packed with jargon. Only the technical readers are going to look there anyway, and they’ll understand the jargon.

Your Turn

Upload one of your own paragraphs into your favorite reading level checker.

How did you score?

And more importantly, how can you adjust the language to lower the reading level??

Written by cplysy · Categorized: depictdatastudio

Oct 31 2022

Incentives for participation

I’ve been thinking recently about bias in evaluation methodology. There’s so many different types of bias it’s hard to keep them all straight, never mind mitigating them all!

One particular area has me interested: 

What bias does offering an incentive to participate introduce?

So, let’s broaden the question and explore incentives for participation generally (don’t worry, we’ll cover bias too).

As evaluators, one of our primary activities is data collection. Some of the most common methods include asking other people to share their thoughts or experiences in surveys, interviews, or focus groups. Sometimes it can be difficult to get people to agree to participate. It’s very enticing to offer an incentive to boost that response rate or sample size. 


Why offer an incentive?

Many argue, myself included, that those with lived experience are experts and knowledge keepers, and should be compensated for sharing their expertise. So, incentives can serve a moral purpose, offering compensation in exchange for expertise.

Incentives can also serve the function of attempting to mitigate non-response bias. Theoretically, by increasing response rates, your data will be that much more robust and representative of the population you are hoping to report on.


Is cash king?

The two most common forms of incentives are cash or gift cards. So, which should you use, when, and why? 

When I was a graduate student, I ran a study that collected data from individuals experiencing challenges with substance use. The Research Ethics Board (REB) at the university would not let me offer cash as an incentive to participate. It never sat well with me. Ethically, who am I, as a researcher or evaluator, to decide whether a participant “deserves” cash or not? Who am I to declare that they can only spend earnings at gift card locations?  Besides, there’s nothing stopping anyone from re-selling gift cards for cash. It seemed like a misstep to me.

More recently I offered a cash incentive to participants for an interview. Many of those participants voluntarily expressed appreciation for the cash support. That project felt better for me.

So, morally, I am a believer that cash is appropriate. Functionally, research says that money is more motivating than other gifts. So, yes, cash may actually be king.


Low budget options

What happens if you don’t have the budget for cash or gift cards? There are still ways to offer incentives.  Alternatives could be:

  • Access to products or services (e.g., 1 month of free access to the services of the organization)

  • Company swag or merchandise 

  • Discounts or coupons (e.g., a 50% discount on your next program registration)

Or perhaps you don’t have the budget to offer everyone an incentive, but you can afford something. In these cases, I’ve used the “chance to win” approach. This is more common in surveys, whereby filling out a survey the participant is entered into a draw to win something, usually a gift; but there’s no reason this couldn’t also be cash. 

CAUTION: Make sure that your cash-alternative prizes (e.g., gift cards or products) don’t introduce new forms of bias!  If you advertise that participants get gift cards to a specific store or restaurant you may be biased toward people who frequent those businesses. If you advertise that participants get a discount on products or services, you may be biased toward people interested in those products or services. 


What about coercion?

I said we’d talk about bias. When offering an incentive, the risk is that it introduces coercion: the practice of persuading someone to do something. It’s a fine balance between motivating someone to spend their time sharing their experience with you in exchange for a token of appreciation, versus inducing a feeling of being compelled because the incentive is so enticing. Coercion exists when a participant accepts otherwise intolerable risk to receive the incentive. I think this risk is real, however, some research has shown that any risk associated with participation is not influenced by incentives. This study found no relationship between the size of the risk and the size of the incentive. 

It may be impossible to prove that an incentive isn’t coercive. The best way to protect participants from risk isn’t by making changes to your incentive, but by examining policy, protocol, and consent within your project or program. Probably the best mitigation strategy is informed consent, letting participants know about their rights to refuse, clearly outlining any risk to participation, and describing how participation does or does not affect their access to services.  Related to this, refusing access or service based on participation is definitely coercive!


What impact does offering an incentive have on your data?

One reason to offer an incentive is to increase the response rate. Increasing response rates should improve your data quality through more valid, representative data. However, there are negative impacts as well – including introducing profile bias based on the specific incentive (as cautioned above). Incentives could also change the responses themselves, either because participants feel compelled to respond positively to receive the incentive, or with even more subtle changes, like improved mood. However, some research suggests that these influences are unlikely.

Ideally, we want people to participate because they care about the outcome, or they have a vested interest in the program or organization. However, motivations to participate cover 3 primary reasons: 1) altruism 2) topical reasons, e.g., the desire to share a specific positive or negative experience, or interest in the topic or 3) egoist reasons, i.e., for the incentive. Most evaluations probably have a mix of these motivations. It can be difficult or impossible, and probably unnecessary to tease them apart. Ensuring strength in your data collection tools and processes will help to mitigate any risk associated with egoist participation.


What is participation worth?

A colleague of mine recently had to counsel a client on whether $100 for survey participation was coercive or not. While it’s not common to have to debate if the incentive is too much, it’s still a good lesson in ethical practice. And begs the question, what is participation worth?

There’s no one answer. In fact, there isn’t even a “right” answer. It depends on several factors including:

  • time burden: is it a 5-minute survey, or a 3-hour focus group?

  • how intense is the participation process?

  • how specific or niche, and therefore possibly difficult to reach, is your target participant group?

  • how specialized is the knowledge or experience the participant group brings? 

  • your project budget!

The higher the burden or intensity, or the more specialized the nature of participation, the higher the perceived value.

Wellesley Institute, out of Toronto, did some exploration in 2018 and found that in research (i.e., not evaluation), participants were paid, on average, $30 for an interview, $25 for a focus group, and $20 for a survey. In my own experience, this is pretty close in evaluation as well. Depending on budget and level of burden (i.e., time commitment) I’ve offered up to $50 for interviews. Wellesley suggests that a good rule of thumb is $25 per hour of participation.


Appropriateness of incentives

While cash may be king, there are other considerations when deciding on incentives. I’ve recently been working on a project where paying for services may introduce trauma for some participants. I’ve worked closely with this project team to develop a plan where the participants are compensated for sharing their experiences, but without the transactional nature of giving an incentive after participation. Specifically, persons with lived experience are invited to participate in an interview; regardless of participation, they are also offered extra support to meet any emergent needs they may have. That extra support is not based on their participation, but on the invitation.

Vulnerable populations may respond to incentives differently, by being more likely to accept risk. Vulnerable populations are also frequent target populations for research and evaluations.  This is a great resource that offers more guidance on compensation for persons with lived experience, including: discussing compensation clearly and upfront, offering options, paying in cash, and offering to pay for additional costs (like child care).

Depending on your participant population there are groups and cultures where exchanging gifts is an act of respect. Consider reviewing your incentive practice from a lens of diversity and intersectionality.

Finally, there is some grey area about who is offered an incentive. For example, you are evaluating a program, commissioned by the organization that runs the program. Part of your evaluation plan is to interview the program participants. I think we can safely agree that offering some form of incentive is justified. Part of the same evaluation plan is to interview the organization leaders and the facilitators of the program. Does it make sense to offer them an incentive? Or is it “part of their job” to participate? To pay them for participation is essentially paying them out of their own budget. In my experience, I have differentiated between those participating in a professional capacity (i.e., not incentivizing staff) and those volunteering to participate (i.e., incentivizing lived experiences or program participants).

A key to ensuring your incentives are appropriate is an open dialogue with your project team, which hopefully includes a representative from your target population. Engage in your own reflective practice as an evaluator and seek input from your colleagues to identify risks you may have missed.


Other Considerations

  1. To offer an incentive, you may need to collect some contact information. With so much data collection being done virtually these days, many incentives are offered electronically, where email addresses are required. This has at least two impacts:

    • Is your participant population likely to have an email address and the capacity to retrieve and access an e-transfer or electronic gift card?

    • Does collecting contact information introduce any ethical risk around identification or breach of confidentiality?

  2. In my experience where most data collection is happening virtually, the idea of bringing food and/or beverages is a moot point, but in the past, I have offered focus group participants snacks and drinks. These “perks” to participating are also an incentive and should be considered thoughtfully.

  3. Arguably outside the discussion of incentives specifically, is reimbursement. Some participants may need to travel or enlist child or elder care to accommodate their participation. It is common practice to offer reimbursement for such expenses, which can take many forms, including cash, bus tickets, cab fare, mileage payment, etc.

  4. I’ve had discussions that the incentive isn’t an incentive, per se, but a “thank-you”. This can be true if the thank-you is given after participation without prior knowledge, or perhaps if the value is so low that it would in no way incentivize anyone. Similarly, some participants have regular hourly rates and can be offered an honorarium to compensate them directly for their time. These distinctions between a thank-you, an honorarium, and an incentive are very blurred. As always, data collection processes and informed consent are the best ways to mitigate risks!


There’s a lot of research about incentives, much more than I’ve touched on here. Hopefully, I’ve covered some of the important ground to guide you in deciding whether to offer an incentive and what form and value that incentive should be.

Remember to include the use of incentives in your evaluation contracts. The expense can be significant!


Sign up for our newsletter

We’ll let you know about our new content, and curate the best new evaluation resources from around the web!


We respect your privacy.

Thank you!


Written by cplysy · Categorized: evalacademy

Oct 31 2022

Using log frames: why they’re useful and how to make one

A Log Frame is a tool that has mainly been used for designing, monitoring, and evaluating international development projects. Using this tool is a way of structuring the main elements in a project or program, and highlighting the logical connections between them. 

In this article, we explain what a Log Frame is (spoiler: it’s not a logic model), why they can be useful tools for program planning and evaluation outside of international development, and how to make one of your own.


What is a Log Frame?

The Log Frame was developed back in 1969 for the U.S. Agency for International Development (USAID). It was developed as a planning tool for international development programs in the form of a matrix which presents a program’s main goal, activities, and what these activities are expected to lead to.

This visual approach helps you to think about the relationships between available resources, planned activities, and the desired changes or results. This structure also helps to explain the linkages between a program’s components.

It follows this main idea:

  1. The successful completion of these activities = the production of these outputs

  2. The production of these outputs = these changes through outcomes

  3. These changes through outcomes = the achievement of these objectives

  4. The achievement of these objectives = contributions to the larger goal

Therefore, this tool can help program planners to explain how they believe change will be realized. For evaluation purposes, the Log Frame also identifies the measures and indicators that will help to monitor the program’s anticipated results. 

Although there are a few models that focus on logical links between a program and its contribution to success, be careful not to confuse Log Frames with the following:

  • Results Frameworks: Log Frames are focused more on how you will get to your program’s goal. Results Frameworks focus more on explaining the program’s results.

  • Logic Models: although the two are very similar, a Log Frame is depicted using a matrix or table, whereas a Logic Model is shown using a flow chart.

  • Theory of Change (ToC): ToC is also used for program design, whereas Log Frames are useful mainly for evaluation only. A ToC is also more explanatory and for explaining more complex initiatives, whereas Log Frames are descriptive and better placed for small to medium sized projects. Log Frames don’t easily capture the how and why in the same way a ToC does.


When and why are Log Frames used?

Since their development for USAID, Log Frames have become a standard approach required by donors for grant applications. For international development programs, they have become a staple of project planning and evaluation. Due to their utility and accessibility, they’re now also being used for programs outside of the international development realm.

Most Log Frames are developed during program design and are updated throughout the program’s lifespan. Log Frames are not set in stone and should be flexible to the program’s needs and any changes happening on the ground. Developing a Log Frame at the program planning stages helps to involve the whole team and allow key stakeholders to provide ideas about how they see the program operating to reach its goals.

Log Frames can be used for the following:

  • To confirm the theory of why your program will result in the desired change. Log Frames can help you to see whether your program will really work and identify any flaws in the theory. It’s all about being logical!

  • Help you in making strategic decisions that align with the logic of how your program will contribute to change and reach its goal. It can also help you to allocate resources to where they will be used most effectively.

  • To support transparency by clearly describing what your program aims to achieve and how. This can help your program to be more attractive to donors by clearly and logically explaining your ideas. It can also help you to make sure that all staff are on the same page.

  • By including indicators of how you will measure change, a Log Frame helps you to develop how you will monitor and evaluate your program. This provides the groundwork for how an evaluation can measure the impact of your program. 


What are the key components of a Log Frame?

A Log Frame is commonly presented as a 4×4 table with 16 cells, though this can be modified if needed. Each row represents types of events that take place to help the program achieve its goals. Although the wording may differ slightly, these include:

  • Main Goal

  • Outputs

  • Outcomes

  • Activities

The first column describes how the program will reach its objective. The second and third columns summarise how the program’s achievements will be tracked through indicators (i.e., measurement of change) and sources of information (i.e., information needed that will allow indicators to be measured). The last column lists the assumptions or risk analysis. These are the factors outside of the program’s control that are necessary to ensure the program’s success.


How do I develop a Log Frame?

It is important to develop a Log Frame with key stakeholders included in the program. Collaborating helps to make sure that it is not developed through a “top-down” approach and leads to better program planning by ensuring that everyone is on the same page in terms of shared objectives. Developing a Log Frame often works best through a mind-mapping session.

Firstly, it is important that there is a clearly established problem your program aims to address. You should also be very aware of the context within which your program will operate. It helps to think about setting your goals first and then working backwards to the grassroots to see what you need to do to reach these goals.

The main questions to consider in the development of your Log Frame include:

  • What will our program achieve?

  • What activities will we complete?

  • What resources will we need to do this?

  • What are the problems and challenges we might face along the way?

  • How will we measure the progress and outcomes of the program?

Example of a Log Frame (Adapted from Tools4Dev)

There can be more than one indicator and assumption listed for each level, but it is good to keep these manageable by using tools such as SWOT analysis (see our free template here), Stakeholder Analyses, and a Risk Matrix.

A Log Frame should also be tested to check the logic. A simple test is to ask the following:

  1. IF these activities are undertaken AND the assumptions hold true, THEN the intended outputs will be created

  2. IF these outputs are delivered AND the assumptions hold true, THEN the purpose will be achieved

  3. IF the purpose is achieved AND the assumptions hold true, THEN the intervention will have contributed to the overarching goal

(Adapted from DFID, 2011)

Once developed, make sure that the Log Frame doesn’t just sit on a shelf throughout program implementation. Review it frequently and use it to support decision-making, manage activities, assess progress, and keep stakeholders aware of plans to monitor progress.


Pros & Cons of using a Log Frame

Benefits of a Log Frame:

  • It ensures objectives are clear and measurable

  • It ensures concrete evidence for achievement is collected

  • Because risks and assumptions are made explicit, problems can be analyzed systematically

Weaknesses of a Log Frame:

  • It may cause rigidity in program management if it is not viewed as something that can be updated throughout program implementation

  • It is a “one size fits all approach” which does not always capture the complexity and context of a program


Have you worked with Log Frames before, or have questions? Comment on this article or connect with us on LinkedIn or Twitter!


Sign up for our newsletter

We’ll let you know about our new content, and curate the best new evaluation resources from around the web!


We respect your privacy.

Thank you!


Written by cplysy · Categorized: evalacademy

Oct 26 2022

Human Centered Report Design

Are you searching for a modern reporting strategy that leads to visual reports other human beings would actually appreciate? I wrote you an eBook.

Human Centered Report Design
A visual guide to the freshspectrum content & communications strategy.
You can download the new eBook here.

Here is what you’ll find inside the 35 page visual eBook. It’s a super easy picture book that should only take you a few minutes to get through.

The Why Behind it All

This is my digital audience theory. I walk through the usual stages of modern development based on my experiences with how most organizations currently approach this work. It’s a pretty inefficient process.

What to Prioritize

In this chapter I talk about the freshspectrum Content Design Strategy. The goal is to be more efficient and focus first on the reporting pieces that provide you with the most value for the time.

Feed the Media Monster

Knowing what to create is one thing. The next thing you need to know is how to share your reporting. In this chapter I walk through my basic communications strategy.

Personal Next Steps

Finally I close with a few suggested next steps if you’re looking to take your work further.

Grab the eBook

Download Here

Written by cplysy · Categorized: freshspectrum

Oct 25 2022

AEA Coffee Break: Five Core Processes for Enhancing the Quality of Qualitative Evaluation 

Presenter: Jennifer Jewiss

Date: 25 October 2022

The presenter had reflective questions for the audience, so I figured I’d put mine here, along with my notes from the webinar.

Reflective questions 1: When I think of qualitative approaches to evaluation, the following words come to mind:

  • open
  • emergent
  • unexpected
  • nuance
  • deep
  • devalued by some
  • harder than people think

They put together a book on qualitative methods in evaluation with chapters authored by many evaluators, then identified themes of what makes up quality in qualitative inquiry:

  1. acknowledging who you are and what you bring to the work (you)
    • positionality
    • how do facets of your identity, history, etc. intersect
    • how does it enrich and limit your work as an evaluator?
      • what blind spots do you have? what learning do you need to do?
  2. building and maintaining trusting relationships (us)
    • throughout the entire evaluation
  3. employing sound & explicit methodology (process
    • a wide array of things that can be done in qualitative inquiry
  4. staying true to the data (what we find)
    • hearing and representing the voices and perspectives of participants
    • be really conscious of what you might be bringing to bear on the data (our own priorities, biases, desires) – monitor that to “keep it in its proper place”
  5. fostering learning (what we learn)
    • helping everyone involved learn, including ourselves
    • open-ended learning helps people to surface that tacit knowledge
  • these things are not unique to qualitative
  • a cycle, not linear. They wanted a spiral/dynamic diagram, but publisher suggested a cycle would be more clear

Reflective question 2: how might one use this model to information qualitative evaluation practice?

  • presenter suggested that each of these elements could be a prompt for reflective writing or reflective art (drawing, collages, etc.)

Written by cplysy · Categorized: drbethsnow

  • « Go to Previous Page
  • Go to page 1
  • Interim pages omitted …
  • Go to page 113
  • Go to page 114
  • Go to page 115
  • Go to page 116
  • Go to page 117
  • Interim pages omitted …
  • Go to page 310
  • Go to Next Page »

Footer

Follow our Work

The easiest way to stay connected to our work is to join our newsletter. You’ll get updates on projects, learn about new events, and hear stories from those evaluators whom the field continues to actively exclude and erase.

Get Updates

Want to take further action or join a pod? Click here to learn more.

Copyright © 2026 · The May 13 Group · Log in

en English
af Afrikaanssq Shqipam አማርኛar العربيةhy Հայերենaz Azərbaycan dilieu Euskarabe Беларуская моваbn বাংলাbs Bosanskibg Българскиca Catalàceb Cebuanony Chichewazh-CN 简体中文zh-TW 繁體中文co Corsuhr Hrvatskics Čeština‎da Dansknl Nederlandsen Englisheo Esperantoet Eestitl Filipinofi Suomifr Françaisfy Fryskgl Galegoka ქართულიde Deutschel Ελληνικάgu ગુજરાતીht Kreyol ayisyenha Harshen Hausahaw Ōlelo Hawaiʻiiw עִבְרִיתhi हिन्दीhmn Hmonghu Magyaris Íslenskaig Igboid Bahasa Indonesiaga Gaeilgeit Italianoja 日本語jw Basa Jawakn ಕನ್ನಡkk Қазақ тіліkm ភាសាខ្មែរko 한국어ku كوردی‎ky Кыргызчаlo ພາສາລາວla Latinlv Latviešu valodalt Lietuvių kalbalb Lëtzebuergeschmk Македонски јазикmg Malagasyms Bahasa Melayuml മലയാളംmt Maltesemi Te Reo Māorimr मराठीmn Монголmy ဗမာစာne नेपालीno Norsk bokmålps پښتوfa فارسیpl Polskipt Portuguêspa ਪੰਜਾਬੀro Românăru Русскийsm Samoangd Gàidhligsr Српски језикst Sesothosn Shonasd سنڌيsi සිංහලsk Slovenčinasl Slovenščinaso Afsoomaalies Españolsu Basa Sundasw Kiswahilisv Svenskatg Тоҷикӣta தமிழ்te తెలుగుth ไทยtr Türkçeuk Українськаur اردوuz O‘zbekchavi Tiếng Việtcy Cymraegxh isiXhosayi יידישyo Yorùbázu Zulu