• Skip to main content
  • Skip to footer
  • Home

The May 13 Group

the next day for evaluation

  • Get Involved
  • Our Work
  • About Us
You are here: Home / Archives for allblogs

allblogs

Mar 31 2021

How to build an online community of practice (8 Tips)

For a little over a year I have had the pleasure of designing and facilitating a specific public health program focused evaluation community of practice. I have had a great partner in this work and have learned a lot about virtual community building.

Today’s post highlights just some of the tips I have learned through experience.

freshspectrum cartoon by Chris Lysy:
Can they really call it a community of practice if the community members don't know one another?

1. Build the Community First.

Far too many online “communities” are not much more than a virtual lecture series serving a defined audience. There is little space made for peer to peer engagement. Is it really a community if the people within don’t know each other or have the opportunity to interact?

One of the biggest challenges building communities in a virtual space is that you don’t need to just replace the lecture hall, you also need to replace the interactions that occur in the hallways and the line for coffee. Communities are built through interaction and engagement, not just a shared interest in a particular topic or membership in a particular group.

Design activities that don’t just serve your audience, but give your community members the space to learn about one another.

freshspectrum cartoon by Chris Lysy: Online communities are made out of people! They're people!

2. Show Faces.

We all want to belong to groups that include actual human beings. Communities of practice are built so that individual members can learn from “people like me,” not a disembodied voice from on high.

That means not just including the community in conversation, but also offering ways to see their faces. Regular, informal, “camera on” group conversations via zoom can help. So can including faces on your webinar invitations.

It’s easy to hide behind the keyboard, so plan your way around that.

*But don’t require videos be turned on during webinars, and don’t do it all the time for everyone. With so many people juggling household responsibilities (taking care of kids and other family) while participating in professional activities, requiring cameras on can alienate certain members of your community.

freshspectrum cartoon by Chris Lysy: All of you attending this webinar are hand selected experts. The greatest minds in our field. We asked you here so that we could deliver a boring forgettable presentation while you eat your lunch and scroll around on Facebook.

3. Bottom up, not top down.

The goal of a community of practice should be to draw upon the expertise of the community. Don’t just think about what they would like to hear, ask them what they would be willing to contribute.

It is certainly easier to just come up with a list of webinar topics and run with it. But sourcing expertise from your community is the best way I’ve found to increase ongoing participation. It takes time and trust building, but ultimately it builds a better community.

freshspectrum cartoon by Chris Lysy: What, they want me to answer a 5 minute survey? Who has time for that?
They want me to lead next month's hour long presentation? How could I say no?

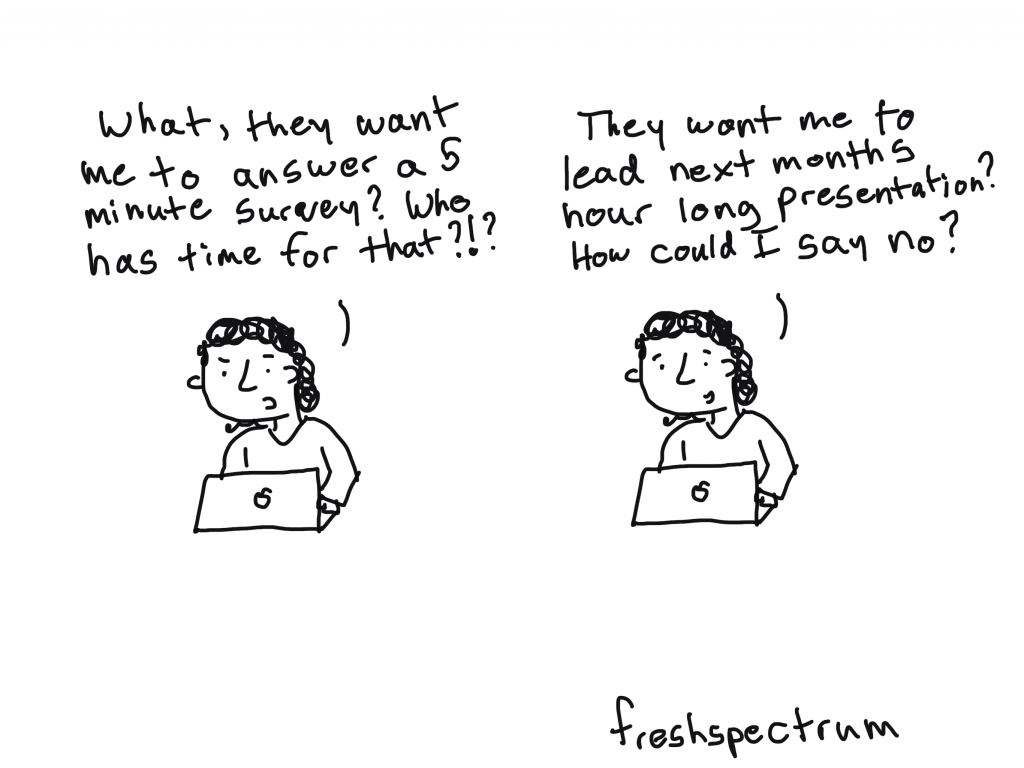
4. When asking less can be asking too much.

We are all worried about taking up too much of people’s time. But don’t be afraid to ask for something big, like webinar presenters, instead of something smaller, like blog posts or comments.

Asking a community member to present during a webinar sounds like a really big commitment. But often they are presenting from their own personal experiences (without needing much in the way of planning) and there is a well-defined deadline. Plus, it feels good to be asked for your expertise.

Asking a community member who doesn’t participate much in the blogging or social media world to comment on a blog post, while a relatively easy ask, can often fall totally out of their comfort zone.

freshspectrum cartoon by Chris Lysy: When will they invent a vehicle that combines all the benefits of a bicycle, taxi cab, bus, train, and airplane into a single product.

5. Assembling your community tech stack.

I get asked a lot, “so what technology do you use?” The answer is a list, not any singular tool. And it always depends on the community.

I think it’s better to think of your tech as a bundle, not a single tool. Here are my go-to tools. Keep in mind, there are many alternatives for each that work just fine.

  • WordPress – for the community hub.
  • Zoom – for webinars and other virtual gatherings.
  • Mailchimp – for a regular email newsletter.
  • Eventbrite – for webinar/event registration.
  • Teachable – for hosting self paced learning modules.
  • Canva – for designing communications materials.
  • YouTube – for hosting webinar recordings.
  • Slack – for member to member communications.
  • Dropbox – for communal resource libraries.

You don’t need everything for every community. If you are not a techie, and don’t have the money to hire someone like me to handle things for you, I would certainly advise you to start small.

freshspectrum cartoon by Chris Lysy: So this is our current content strategy (we are winging it).

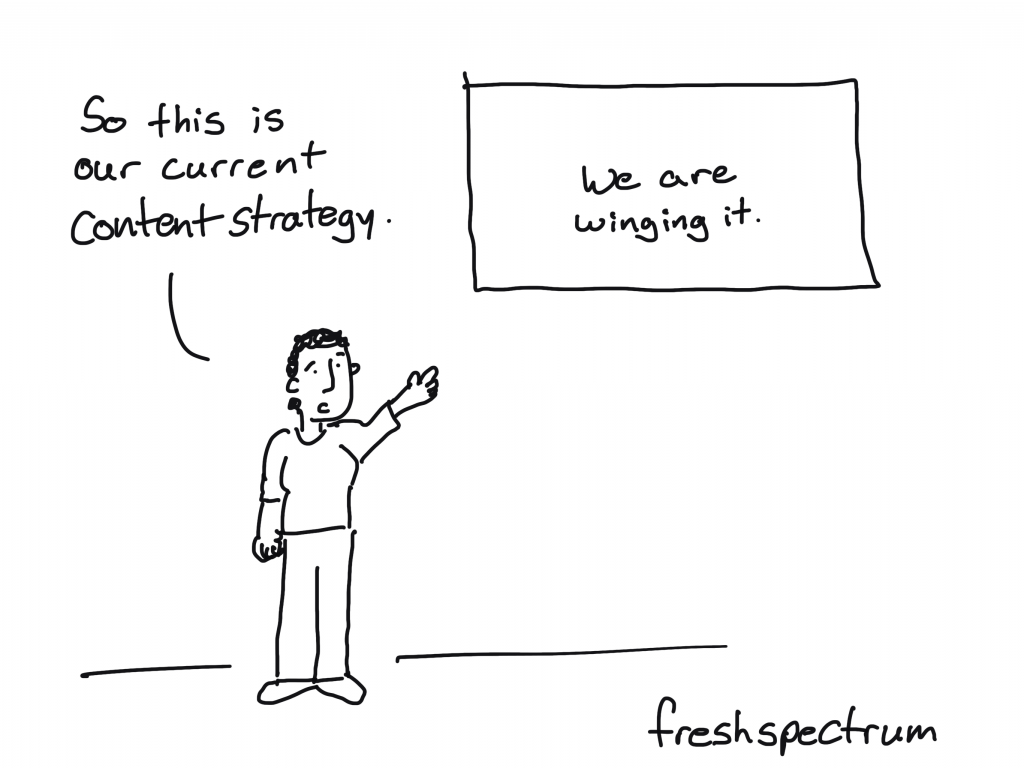
6. Developing a content strategy.

Regular content is important. Just how regular depends on your community.

Don’t make the mistake of creating a forum and expecting your community to just show up and fill it up with great content. Most of the time, this just leads to dead forums and little to no participation.

Instead try to set a content schedule. Not sure where to start, how about a monthly webinar? This requires you to create a registration page, put out an initial announcement blog post, sharing that announcement and post through email, sending a follow-up reminder email, creating a recap blog post after the event, posting the recording, and sharing the recap/recording through an email.

As you can see, even just one webinar a month can fill a content calendar. Especially if you add bonus content/downloads in the prep stages and the recap. Put it all down on a calendar, and repeat each month.

freshspectrum cartoon by Chris Lysy: 
Webinar Agenda
First 15 minutes- fumble around with the technology.
Next 10 minutes - expert presentation (who will be on mute but not know it).
Next 15 minutes- expert loses internet, time spent trying to get them back.
Next 15 minutes - Give up hope, spend rest of the time showing off pets.
Final 5 minutes - Expert returns (out of breath for some reason), tries to cram 40 minutes of presentation into 5 minutes.

7. Mixing your engagement methods.

Try expert seminars, panel presentations, informal roundtables, expert Q&As, and other engagement methods. There is no rule saying you need to stick to one and only one format. Experiment until you find the right mix for your community.

freshspectrum cartoon by Chris Lysy: When i was your age, we presented in front of real people. We could see their eyes and hear their voices. If our presentation was bad, we knew it.

8. Evaluating your efforts and determining needs.

Once you get an active community going, needs assessment should become easier. But it takes time to get to that point, and early surveys might see very low response rates.

Early on in your efforts I suggest forming an advisory group (drawn from your membership) to help guide your ongoing work. Try to get a group that represents different facets of your overall community. Then set up a regular virtual get together once a quarter or bimonthly.

Written by cplysy · Categorized: freshspectrum

Mar 30 2021

El desarrollo de capacidades para la “traducción” de conocimiento

El conocimiento debe destilarse antes de que esté listo para su aplicación. Es esencial sintetizar la información existente para contextualizar e integrar los hallazgos de un estudio de investigación individual dentro de un cuerpo de conocimiento más amplio.

El trabajo de ODI, para traducir el conocimiento y promover debates de políticas más informados por la evidencia, ha arrojado seis lecciones clave:

1. Las capacidades básicas para la traducción de conocimientos deben abordarse de manera integrada.

2. Se necesita un enfoque específico para garantizar que se creen vínculos entre las capacidades a diferentes niveles.

3. La traducción de conocimientos se basa en las capacidades tanto de la oferta como de la demanda para promover la adopción de la investigación.

4. Adaptar las iniciativas a los contextos locales es fundamental para su éxito, por lo que una buena comprensión del contexto político es fundamental.

5. El fortalecimiento de las capacidades para influir en las políticas consiste en fomentar una cultura de aprendizaje y reflexión continuos, lo que requiere desarrollar relaciones lo suficientemente fuertes como para desafiar las dinámicas de poder desiguales.

6. Abordar las motivaciones e incentivos es clave para fortalecer las capacidades de traducción del conocimiento. Convertir a un investigador en un emprendedor de políticas o un instituto de investigación en un grupo de expertos centrado en políticas es extremadamente difícil. Si bien las capacidades funcionales son importantes, la motivación para cambiar es un aspecto crucial, que puede facilitar u obstruir el desarrollo de capacidades. El liderazgo es un factor clave aquí.

Referencia

Nicola Jones, Ajoy Datta y Harry Jones con EDPN partners (2009) Seis dimensiones de la interfaz de políticas de desarrollo y conocimiento. ODI. Box 9: Six key lessons on capacity building for knowledge translation (p.32)

Written by cplysy · Categorized: TripleAD

Mar 30 2021

How to Use Vlookup in Microsoft Excel: Two Step-by-Step Examples for Beginners

Vlookup is my all-time favorite function in Excel!

(Well, the entire lookup family—vlookup, hlookup, index-match, and xlookup.)

In this blog post, you’ll learn:

  • What vlookup is used for;
  • Why vlookup can be tricky; and
  • How to fill in the four pieces of the formula.

What Vlookup Is Used for in Excel

Vlookup helps us merge data from various tables, sheets, and files into a single table that we can use for our analyses.

Why Vlookup is Tricky for Novices

Sometimes Excel novices are hesitant to try vlookup because it requires that you fill in four different pieces of information.

Learning the Excel lingo here is truly like learning a new language. Stick with it and keep practicing, and you’ll be a fluent vlookup user in no time!

Here’s the information that we’ll need to complete: =vlookup(lookup_value,table_array,col_index_num,[range_lookup])

Let’s walk through each of the four segments of the vlookup function.

Our Fictional Scenario

I’ve got five people: Ann, Isaac, Tony, Keely, and Dan. I’ve also got two different tables of data: Favorite Color and Favorite Food.

Let’s pretend I want to create a single dataset that contains both the colors and the foods together.

In a perfect world, I’d be able to copy and paste the colors and foods together.

But in the real world, we’ve typically got different numbers of people in each of the original tables. For example, we’ve got information about Ann, Isaac, Tony, and Dan in our Favorite Color table, but we’ve only got information about Ann, Keely, and Isaac in our Favorite Food table, so a simple copy and paste isn’t possible.

Sure, with just five people, we could fill in this information by hand. But what if our dataset contains information about 50 people? Or 50,000 people? Copying and pasting could take all day, and we’d probably make a million mistakes along the way. Vlookup to the rescue!

How to Use =Vlookup() in Microsoft Excel

Here’s how to fill in each of the four pieces of the vlookup formula.

Step 1: Fill in the lookup_value

First, let’s fill in the lookup_value, which is the first piece of the vlookup function.

The lookup_value is the cell that contains the person’s name or ID number that we’re interested in. These names or ID numbers are the links that connect all the tables together.

The names or ID numbers must be located in the first column of each table–in the first column of your new combined dataset and in the first column of every single table from which you’re pulling data.

In this example, watch as I type =vlookup( into cell B8. Next, click on the cell that contains the name or ID number that you want to look up in one of your other tables. Then, insert a comma, which moves us on to the second section of the function.

So far, my function reads: =vlookup(A8,

In this example, watch as I type =vlookup( into cell B8. Next, click on the cell that contains the name or ID number that you want to look up in one of your other tables. Then, insert a comma, which moves us on to the second section of the function.

Step 2: Fill in the table_array

Second, we have to indicate the table_array.

The table array is the table or dataset from which we’re pulling data.

In this example, we want to get information from the Favorite Color table into our master table down below. The table_array for the Favorite Color table is A1:B5. In other words, that table begins in cell A1 and ends in cell B5.

My function reads: =vlookup(A8,A1:B5,

In this example, we want to get information from the Favorite Color table into our master table down below. The table_array for the Favorite Color table is A1:B5. In other words, that table begins in cell A1 and ends in cell B5.

Step 3: Fill in the col_index_num

Third, we have to indicate the col_index_num.

This column index number is the number of the column we care about. Just type in the number of the column you’re interested in.

For example, we want to know favorite colors, which are located in the second column of our Favorite Color table, so we type a 2 into the vlookup function. As usual, conclude with a comma to move on to the fourth and final segment of our function.

My function reads: =vlookup(A8,A1:B5,2,

For example, we want to know favorite colors, which are located in the second column of our Favorite Color table, so we type a 2 into the vlookup function. As usual, conclude with a comma to move on to the fourth and final segment of our function.

Step 4: Fill in the range_lookup

Fourth, we need to indicate the range_lookup..

We have to type the word true or false into the fourth and final section of our vlookup function.

A true will give us an approximate match and a false will give us the exact information we’re looking for. We obviously want precise information, so type false into the function and end with a closing parenthesis.

My completed function reads: =vlookup(A8,A1:B5,2,false)

We can see that Ann’s favorite color is blue.

Fourth, we need to indicate the range_lookup. We have to type the word true or false into the fourth and final section of our vlookup function.

A Second Vlookup Example

Let’s go through a second vlookup example to make sure the four pieces of the function make sense.

We’ll continue creating a master table that combines content from both the Favorite Color and Favorite Food tables into a single table.

First, in cell C8, type =vlookup(A8, to set the lookup_value as Ann.

First, in cell C8, type =vlookup(A8, to set the lookup_value as Ann.

Second, indicate the boundaries of the Favorite Food table that we want to pay attention to. My function now reads =vlookup(A8,D1:E4

Second, indicate the boundaries of the Favorite Food table that we want to pay attention to. My function now reads =vlookup(A8,D1:E4

Third, tell Excel which column of the Favorite Food table to focus on. The foods are listed in the second column of that mini-table, so enter a 2 into the vlookup function. My function says =vlookup(A8,D1:E4,2

Third, tell Excel which column of the Favorite Food table to focus on. The foods are listed in the second column of that mini-table, so enter a 2 into the vlookup function. My function says =vlookup(A8,D1:E4,2

Finally, type false into the function and close your parentheses. The completed function says =vlookup(A8,D1:E4,2,false) and tells us that Ann’s favorite food is pizza. 

Finally, type false into the function and close your parentheses. The completed function says =vlookup(A8,D1:E4,2,false) and tells us that Ann’s favorite food is pizza.

Vlookup takes time to sink in, so go easy on yourself if you don’t “get it” right away. I promise that the time-savings from vlookup are worth the learning curve.

Written by cplysy · Categorized: depictdatastudio

Mar 28 2021

Creating & Labeling Small Multiple Bar Charts in Excel

One of the most popular Excel tricks in my data visualization workshops is creating small multiple bar charts. This post is a guide for how to create this type of chart. It also explains how to go beyond the Excel defaults to automatically add labels on the outside end of each bar.

The post Creating & Labeling Small Multiple Bar Charts in Excel appeared first on Elizabeth Grim.

Written by cplysy · Categorized: elizabethgrim

Mar 25 2021

Aprendizaje sobre la gestión basada en resultados

3267227227_660b6ab4f4_b

Continuando con un post anterior sobre el “sueño del aprendizaje de evaluaciones y revisiones de la gestión basada en resultados“, adentrándonos un poco más en el contenido de este documento, de marzo de 2019, desde la OCDE: “Aprendizaje de evaluaciones y revisiones de la gestión basada en resultados” por Janet Vähämäki y Chantal Verger.

El propósito último de la cooperación al desarrollo es lograr resultados, (1) lo que significa generar un cambio tangible y sostenible para (a) las personas, (b) las sociedades y ( c)  el medio ambiente. (2) Para que esto suceda, la gestión basada en resultados requiere que los actores responsables del desarrollo establezcan: (a) objetivos claros con los resultados esperados, (b) metas e indicadores, y (c) un sistema para medir cómo se están desempeñando en relación con sus metas. También necesitan (3) utilizar la información generada sobre el desempeño y los resultados de la cooperación para el desarrollo (a) para la rendición de cuentas y la comunicación, así como (b) para la toma de decisiones y el aprendizaje.

¿Qué hemos aprendido de la implementación de la gestión basada en resultados en las organizaciones de cooperación al desarrollo durante los últimos 20 años? ¿Qué avances y beneficios se pueden ver? ¿Cuáles son los principales desafíos y efectos no deseados? ¿Existen buenas prácticas para abordar estos desafíos?

Este documento resume y analiza los hallazgos sobre el progreso, los desafíos y las consecuencias no deseadas de la implementación de la gestión basada en resultados (GBR) en la cooperación para el desarrollo. La reseña:

(1) se basa principalmente en los hallazgos de varias evaluaciones y revisiones de los sistemas de GBR realizadas por miembros del Comité de Asistencia para el Desarrollo (CAD), la Secretaría de la OCDE y otros órganos en los últimos cuatro años (2015-2018).

(2) compara estos hallazgos con estudios anteriores y se basa en las lecciones que surgen de los nuevos métodos de gestión de la cooperación al desarrollo que están llevando a cabo varias instituciones e iniciativas mundiales.

El examen de las evaluaciones recientes revela tanto las áreas de progreso como los desafíos pendientes, de la siguiente manera:

• Los proveedores han avanzado en la integración de la GBR en sus sistemas internos (planificación, implementación e informes). Como resultado, (1) están mejor equipados para monitorear e informar sobre datos de productos y datos de resultados a corto plazo, y (2) utilizan cada vez más los datos de resultados para fines de comunicación y rendición de cuentas a nivel nacional.

• Si bien algunas evidencias apuntan a (1) una correlación positiva entre la calidad del seguimiento y la evaluación a nivel de proyecto y las valoraciones de los resultados del proyecto, (2) se observa un progreso desigual en el uso de la información de resultados para la orientación y el aprendizaje. Esto podría reducir la contribución potencial de la GBR a los resultados de desarrollo, un área que debería explorarse más a fondo.

• Los desafíos observados con la implementación de la GBR, a menudo ya mencionados en revisiones anteriores de la GBR, se relacionan con las dimensiones de gestión estratégica, organizativa y técnica. Estos incluyen: i) orientación e incentivos insuficientes sobre la GBR que, combinados con la falta de una cultura de resultados, llevan al personal a interpretar y aplicar la GBR de manera inconsistente; ii) problemas estructurales y de sistema que afectan la cadena de resultados; iii) limitaciones de capacidad; iv) problemas de medición y método, que dificultan la evaluación de cómo las intervenciones contribuyen a los resultados del desarrollo; yv) asimilación limitada de las dimensiones de apropiación y armonización en los países socios, en contra de los compromisos recientes de apoyar y utilizar los datos de resultados impulsados ​​por los países.

• La revisión también identificó tres consecuencias no deseadas que no fueron previstas y limitan el potencial de la GBR. Los proveedores tienden a:

i) priorizar lo que se puede medir fácilmente (fijación en la medición);

ii) perseguir el propósito de la rendición de cuentas a expensas del aprendizaje y la dirección de las políticas (suboptimización); y

iii) se vuelven demasiado burocráticos y rígidos, lo que aumenta los costos de transacción y obstaculiza la innovación (implementación contraproducente).

Estos desafíos y consecuencias no deseadas se vuelven más importantes cuando una organización no ha comunicado claramente el propósito de su enfoque y sistema de resultados. Sin embargo, las revisiones y evaluaciones no llevan a las organizaciones a reconsiderar drásticamente el enfoque de la GBR. Las recomendaciones apuntan más bien a mejorar el funcionamiento del enfoque en la práctica (por ejemplo, mediante una mejor orientación y formación).

Mientras tanto, una serie de nuevas iniciativas tenían como objetivo desarrollar o probar herramientas de gestión que promuevan la adaptabilidad y el aprendizaje para abordar la complejidad. Éstas se basan en enfoques que se centran en (a) cómo se comprenden los problemas y (b) cómo se utilizan la evidencia y el aprendizaje para resolver estos problemas. Si bien estos enfoques a veces se presentan como “alternativas” a la GBR, la revisión en realidad muestra que el aprendizaje, la apropiación y la adaptación fueron características clave de los enfoques de la GBR, en particular cuando se desarrollaron en el momento de la Declaración de París sobre la Eficacia de la Ayuda (2005). El renovado énfasis puesto en estos aspectos es útil ya que la práctica de la GBR se ha reducido en algunos casos a enfoques basados ​​en el desempeño y necesita evolucionar para responder mejor al nuevo contexto de desarrollo que implica lidiar con la complejidad y múltiples tipos de asociaciones.

Adaptarse a los contextos locales y ser lo suficientemente flexible para responder a los cambios y la retroalimentación del desempeño requiere:

i) centrarse en comprender mejor el contexto local;

ii) adaptar las intervenciones a los contextos locales;

iii) adaptar las intervenciones a medida que evoluciona el contexto: (a) mientras los resultados esperados se mantienen sin cambios, (b) el camino para alcanzarlos (y por lo tanto los productos) puede evolucionar donde sea necesario. (a) Esto implica delegar más autoridad sobre el terreno.

La gestión adaptativa también es importante a nivel corporativo (en sede):

(A) Una teoría del cambio que capte cómo los diferentes canales e instrumentos de ayuda contribuyen a los objetivos generales establecidos para la política de cooperación al desarrollo puede apoyar una mayor comprensión de la cadena de resultados.

(B) Si bien no existe un enfoque de “talla única” dado que las organizaciones operan en varios entornos y están sujetas a diferentes procesos de gobierno, existen elementos esenciales de los sistemas de GBR, tales como: (1) un propósito claro para GBR, (2) teoría (es) del cambio, (3) marcos de resultados, (4) procesos de seguimiento y evaluación, (5) ciclos de retroalimentación documentados y (6) procesos relacionados de toma de decisiones y presentación de informes, (7) gestión del conocimiento y sistemas de aprendizaje, así como (8) incentivos para el personal.

Written by cplysy · Categorized: TripleAD

  • « Go to Previous Page
  • Go to page 1
  • Interim pages omitted …
  • Go to page 195
  • Go to page 196
  • Go to page 197
  • Go to page 198
  • Go to page 199
  • Interim pages omitted …
  • Go to page 310
  • Go to Next Page »

Footer

Follow our Work

The easiest way to stay connected to our work is to join our newsletter. You’ll get updates on projects, learn about new events, and hear stories from those evaluators whom the field continues to actively exclude and erase.

Get Updates

Want to take further action or join a pod? Click here to learn more.

Copyright © 2026 · The May 13 Group · Log in

en English
af Afrikaanssq Shqipam አማርኛar العربيةhy Հայերենaz Azərbaycan dilieu Euskarabe Беларуская моваbn বাংলাbs Bosanskibg Българскиca Catalàceb Cebuanony Chichewazh-CN 简体中文zh-TW 繁體中文co Corsuhr Hrvatskics Čeština‎da Dansknl Nederlandsen Englisheo Esperantoet Eestitl Filipinofi Suomifr Françaisfy Fryskgl Galegoka ქართულიde Deutschel Ελληνικάgu ગુજરાતીht Kreyol ayisyenha Harshen Hausahaw Ōlelo Hawaiʻiiw עִבְרִיתhi हिन्दीhmn Hmonghu Magyaris Íslenskaig Igboid Bahasa Indonesiaga Gaeilgeit Italianoja 日本語jw Basa Jawakn ಕನ್ನಡkk Қазақ тіліkm ភាសាខ្មែរko 한국어ku كوردی‎ky Кыргызчаlo ພາສາລາວla Latinlv Latviešu valodalt Lietuvių kalbalb Lëtzebuergeschmk Македонски јазикmg Malagasyms Bahasa Melayuml മലയാളംmt Maltesemi Te Reo Māorimr मराठीmn Монголmy ဗမာစာne नेपालीno Norsk bokmålps پښتوfa فارسیpl Polskipt Portuguêspa ਪੰਜਾਬੀro Românăru Русскийsm Samoangd Gàidhligsr Српски језикst Sesothosn Shonasd سنڌيsi සිංහලsk Slovenčinasl Slovenščinaso Afsoomaalies Españolsu Basa Sundasw Kiswahilisv Svenskatg Тоҷикӣta தமிழ்te తెలుగుth ไทยtr Türkçeuk Українськаur اردوuz O‘zbekchavi Tiếng Việtcy Cymraegxh isiXhosayi יידישyo Yorùbázu Zulu