• Skip to main content
  • Skip to footer
  • Home

The May 13 Group

the next day for evaluation

  • Get Involved
  • Our Work
  • About Us
You are here: Home / Archives for allblogs

allblogs

Aug 20 2020

La síntesis de los hallazgos de las evaluaciones.

Como parte del “RTD TIG Week” de la AEA, “La síntesis de estudios de imitación ayuda a responder preguntas de política realmente importantes” Gretchen Jordan, pasaba el mensaje de que las grandes preguntas que nos piden que respondamos requieren que avancemos hacia el uso de marcos lógicos de evaluación acordados y adaptados al tipo y contexto del programa para aprender de la síntesis de los hallazgos de las evaluaciones.

Además nos indica cinco pasos para una evaluación de síntesis para informar la política de investigación e innovación:

1. Acuerde la (s) pregunta (s) que serán respondidas por la evaluación de síntesis. Un ejemplo es “¿Qué impactos técnicos, económicos y sociales han ocurrido y qué programas y otros factores contribuyen a ellos?”

2. Diseñe un conjunto de evaluaciones de tal manera que sus hallazgos puedan sintetizarse de manera creíble. Consulte los modelos lógicos genéricos, los indicadores y el glosario propuestos en “Evaluación de los resultados de la investigación financiada con fondos públicos…”, el documento del Grupo de interés temático sobre investigación, tecnología y desarrollo de 2015.

3. Elija múltiples programas de I + D y / o áreas de programas para participar con la participación de las partes interesadas clave, en particular los gestores de programas.

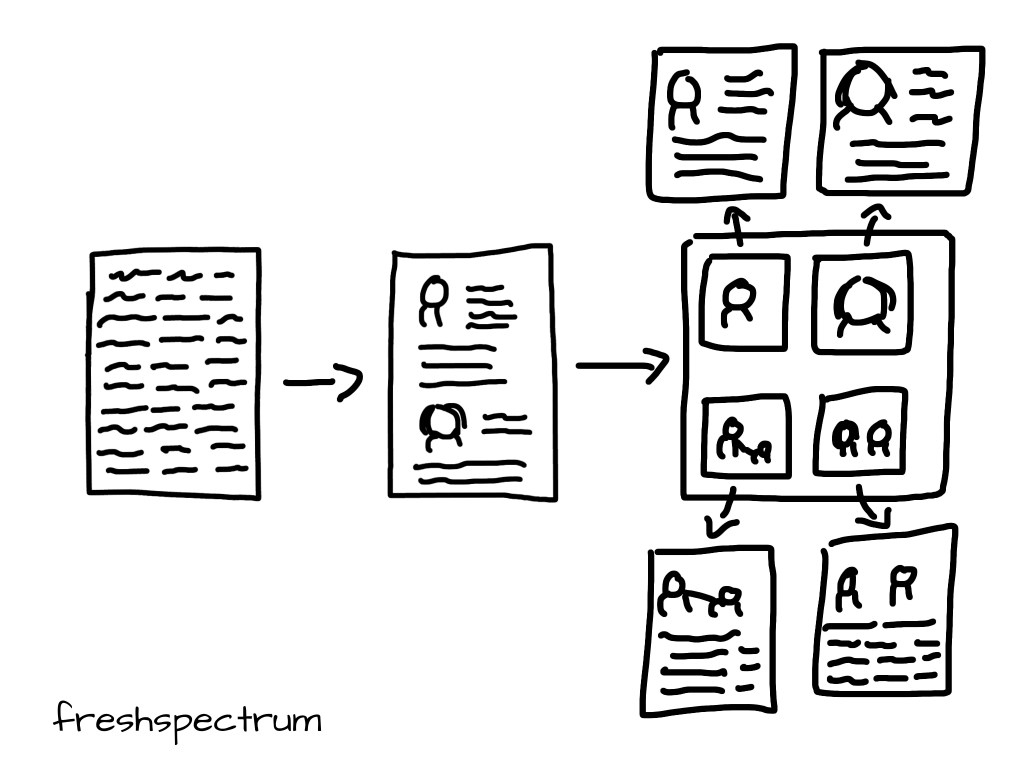
4. Implementar las evaluaciones individuales utilizando el diseño de evaluación común. Idealmente, habría hasta 30 estudios individuales.

5. Incluya todos los hallazgos de los estudios individuales, incluidos los datos sobre el contexto, en una base de datos. Realice un análisis de síntesis. Presenta la nueva evidencia y conclusiones.

Written by cplysy · Categorized: TripleAD

Aug 19 2020

Choosing the right images for reports, presentations, and blog posts.

You already know that images are important.

Without visuals there is no way we would be able to process the vast amount of information that we are now exposed to on a daily basis. 

An image is a trail marker, a waypoint.  It’s a preview of what’s to come, to help you decide before you click to the next page.  It’s a support to capture an audience’s attention while standing at a podium (or in a little box on Zoom) speaking our words.

This image has an empty alt attribute; its file name is 6-1024x768.png

I started drawing cartoons nine years ago because it was fun.  But I kept drawing them because it was important.  Hundreds of cartoons later, I’d like to think I’ve learned a thing or two about what makes for the right image.

In this week’s email I’ll share some of the important lessons I’ve learned over the years, along with some inspiration.

Your images should not just repeat what is written.

This image has an empty alt attribute; its file name is 3-1024x768.png

This is a lesson I learned from Maurice Sendak.  As an illustrator, slide deck designer, report writer, or data visualizer you have to fight the lazy tendency of just repeating what’s on the page with your visuals.  Is simply repeating your written analysis with a chart serving the words? 

An illustration is an enlargement, and interpretation of the text, so that the reader will comprehend the words better. As an artist, you are always serving the words.

You must never illustrate exactly what is written. You must find a space in the text so that the pictures can do the work. Then you must let the words take over where words do it best. It’s a funny kind of juggling act.

Sendak, Carle, Provensen, and 20 Other Beloved Illustrators’ Advice to Children on Being an Artist

There is nothing too serious for an image, even a cartoon.

This image has an empty alt attribute; its file name is 8-1024x768.png

There are times when it’s hard to find the words to approach a tough subject.  But I find that the right photograph, chart, cartoon, or comic can create an entry point when words fail.  

For inspiration, check out a piece of amazing work created by Ben Passmore.

Your black friend is sitting in a coffee shop, your favorite coffee shop…

Congratulations Ben Passmore on “Your Black Friend” winning the 2017 Igantz Award for “Outstanding Comic” at this year’s Small Press Expo!

Find your own visual voice.

This image has an empty alt attribute; its file name is 7-1024x768.png

There are many different styles of illustration. Find one that works for you.

I know evaluators who prefer to illustrate their work with art. I know some who prefer to use infographics. I know others who use memes. Katherine Haugh is an evaluator who has also built up expertise as a graphic recorder. Check out some of her work for inspiration.

In addition to presenting on visual note-taking and journey mapping as evaluations tools, I also attended a few interesting sessions. Take a look below to see my visual notes from the sessions I attended.

Contribution, Leadership, Renewal: A Visual Recap of Evaluation 2019

It’s not the quality of the illustration that matters.

This image has an empty alt attribute; its file name is 4-1024x768.png

Having the ability to create your own illustrations can save a lot of time.

Lots of evaluators are readers and writers. But many are… how do I say this… “creatively tentative.”  Mike Rohde is one of a number of graphic notetakers who has written books with advice for the people who self proclaim, “I can’t draw.”  

People relax, try, experiment and are blown away by what they are able to produce of value with visuals when judgement on the quality of the drawing is removed and replaced with a focus on the ideas behind them. I call it ‘Ideas, Not Art.’

“Make ideas, not art”: The Sketchnote Workbook by Mike Rohde

Think of Data Visualization as a form of illustration.

This image has an empty alt attribute; its file name is 1-1024x768.png

Mostly because it is a form of illustration.

But also because it gives you a purpose beyond simply representing numbers.  To play off Maurice Sendak’s advice, as a visualizer you are creating images to serve the data.

I get asked a lot for examples of how to visualize qualitative data, to which I always answer, illustration!  Ann K Emery wrote a nice post years ago summarizing a variety of styles.

Are you looking for ways to display your qualitative data? The vast majority of data visualization resources focus on quantitative data. In this article, let’s look at some of your options for qualitative data visualization, like word clouds, photographs, icons, diagrams, and timelines.

How to Visualize Qualitative Data

Images are a user-experience element.

This image has an empty alt attribute; its file name is 2-1024x768.png

So what does that mean?  Well your choice of image is going to interact with a reader’s experience of your work.  If you are really serious about how people receive your work, searching stock photo sites for just any image that “feels right” is insufficient.  

Also, there is a whole field who studies this kind of stuff.  Check out this post by Senior User Experience Designer Aurora Harley.

Videos, animated GIFs, images, and other multimedia components should not be added as “fluff” or to “jazz up” a website, app, or other medium. They are user-experience elements, and must be filmed, designed, and produced with an eye toward usability and interaction.

How to Film and Photograph Online Content for Usability: UX Details for Videos and Images

Just because it can be shared with a simple chart doesn’t mean it should.

This image has an empty alt attribute; its file name is 5-1024x768.png

I am a huge fan of Mona Chalabi and her ability to turn simple numbers into influential works of art.  Take this infographic for example.  The argument could have been made with a simple stacked bar chart or icon array.  But the way she presented it, the chart became a story book.

US courts have never looked like the populations they represent. But the overrepresentation of white men on federal benches had started to improve up until recently. According to the American Constitution Society (ACS), “under the Trump administration, this progress has stalled”.

Datablog: Trump’s courts takeover is male and white

Written by cplysy · Categorized: freshspectrum

Aug 19 2020

What is Evaluation? A Review of AEA’s Recent Post


Evaluators are equipped to ask and answer some pretty complex questions. We are not afraid to tackle abstract ideas and make sense of messy data. However, there is one question that can be tough to succinctly answer – what is evaluation?

As evaluators, you can likely recall sitting at family dinners or catching up with a friend when they ask you “what is evaluation?” You may have even had this conversation with colleagues or clients. My initial reaction is “where do I begin?” or “how do I explain evaluation to a non-evaluator?”

Many evaluators and evaluation societies have attempted to answer this question. The Canadian Evaluation Society (CES) consulted members and published their findings on this very topic. This is the definition they came up with:

Evaluation is the systematic assessment of the design, implementation or results of an initiative for the purposes of learning or decision-making.

The need to explain evaluation is likely to come up again and again for evaluators. Fortunately, the American Evaluation Association (AEA) recently created a series of videos and short summaries to explain evaluation. Their post is intended to help us define our profession and better explain the value of evaluation to outsiders.

AEA presents evaluation in the context of three sectors: Organizational, Teaching, and Independent or Consultant. To better understand the work of evaluation in the sectors, AEA interviewed three evaluators. The remainder of this article will review learnings from the AEA post as well as some potential implications for the future.

Evaluation Sectors

Organizational Evaluation

This sector refers to working internally within an organization. Some examples may include: government, non-profits, charities, foundations, or even industry. AEA interviewed Eric Barela, the first Measurement & Evaluation professional hired by Salesforce. Here is a summary of what he had to say about being an internal evaluator:

  • Approach evaluation by asking three questions:

    • What? To gain an understanding of what an organization is doing

    • So what? To see if anything is happening

    • Now what? To use the information to make change or move from “good” to “great”

  • Evaluation is becoming more applicable to other industries, including for-profit organizations. He feels this is driven by the desire to focus more on social impact.

  • As an internal evaluator, he helps his organization ask questions, understand data, and then act on it. He poses two other questions that help him in his evaluation role at Salesforce:

    • How do we know this is happening?

    • What do we need to know in order to improve what we’re doing?


Teaching Evaluation

The teaching of evaluation within academic settings is viewed by AEA as a main sector of practice. AEA recognizes that evaluators come from diverse backgrounds and there is currently no set educational pathway nor is there a licensing body for the profession. However, there are academic institutions that offer evaluation courses to help students prepare for a career in evaluation.

Karen Jackson, from the Leadership Studies and Adult Education department at North Carolina A&T State University, was interviewed to gain more insight into the teaching of evaluation. Here are some key takeaways from her interview:

  • Defining evaluation is a complicated task, but the definition should be flexible to allow for adapting in diverse settings.

  • Academic institution, like hers, offer evaluation courses that focus on the methodology, cultural competency and application of skills.

  • She often starts a course by asking her students “what is evaluation?” The initial perspective is that evaluation is a means of assessment, testing, or a way to meet funder requirements.

  • As her courses progress she encourages her students to ask themselves “why they are doing an evaluation.” This leads to answers that include learning, improvement and trust – which she argues are at the root of evaluation.


Independent Evaluator or Consultant

The final sector described by AEA refers to external evaluations that are conducted by independent evaluators or consultants. AEA views independent evaluation as a way to boost public confidence or verify what an organization is doing. AEA interviewed two consultants about their experience in independent evaluation: Jara Dean-Coffey and Karen Jackson. Both interviewees aim to discover insights to help their clients make decisions. Here is a summary of what they had to say:

Jara Dean-Coffey

  • Relies on six areas to help her clients:

    1.     Evaluative thinking

    2.     Evaluative practices

    3.     Strategy

    4.     Communication

    5.     Capacity building

    6.     Coaching

  • She recommends always starting with evaluative thinking to understand: “the context, the assumptions, the values, and the outcomes” of her client. This includes reviewing the organization’s theory of change.

  • One strategy she offers is to start with what the client feels is most important for them to answer at the moment.


Karen Jackson

  • Karen Jackson views her purpose as “help[ing] organizations learn more about themselves.”

  • She seeks to understand if clients are achieving their goals and if not, help them take the steps to do so.

  • She believes that independent evaluators have the opportunity to give people a voice and work with communities.

Next Steps

The breakdown of the definition by sector combined with the three evaluator perspectives was a helpful way for AEA to explain evaluation. There were also common themes that emerged across the sectors, such as: learning, helping others to ask meaningful questions, and identifying ways to improve. Revisiting Eric Barela’s use of the question “now what?”, I have some suggestions on how to use the AEA post and insight moving forward.

  • Ask yourself the same questions to understand your practice: What does evaluation mean to you? How do you approach evaluation? And what do you find rewarding about your work?

  • Look for sectors that may be missing from AEA’s overview. For example, should ‘Evaluation Research’ be included in the definition?

  • Create your own definition of evaluation. Using AEA’s recent post and/or other definitions (such as the one offered by CES), create your own definition of evaluation and what you do in your role.  

  • Advocate for evaluation in these three sectors and beyond. Large for-profit companies, like Salesforce, are starting to see the importance of evaluation – let’s keep that momentum going!


Conclusion

AEA’s post does a good job at explaining evaluation in a succinct way. For me, I have never worked in the Learning Evaluation sector, but I still found Karen Jackson’s approach and perspective on evaluation to be both relatable and useful. Likewise, I think movement between these sectors is expected – both in terms of the definitions put forward, the skillsets used and the nature of evaluators having the ability to work in multiple sectors. 

AEA’s explanation of evaluation is similar to many other definitions put forward by societies (i.e CES). I think what differentiates this post from other definitions is that it incorporates the experiences and perspectives of multiple evaluators by effectively using video. The use of interviews result in an overview of evaluation that is meaningful to evaluators as well as outsiders.

I think the question “what is evaluation?” and our attempt to define it is an on-going process with no end in sight. I think this is what makes evaluation interesting – it continues to expand and evolve by incorporating new ideas and entering new settings. A flexible definition is key to our profession and I think AEA’s post does a good job at showing the complexity, yet inclusivity of evaluation. 


Sign up for our newsletter

We’ll let you know about our new content, and curate the best new evaluation resources from around the web!


We respect your privacy.

Thank you!


Written by cplysy · Categorized: evalacademy

Aug 18 2020

Políticas y plataformas de apoyo al aprendizaje en Naciones Unidas

Continuando con el informe de la “Joint Inspection Unit” de Naciones Unidas: “Políticas y plataformas de apoyo al aprendizaje: hacia una mayor coherencia, coordinación y convergencia“, al que nos referimos en nuestro anterior post El aprendizaje como fuerza transformadora que puede romper los silos, aquí las principales hallazgos y conclusiones:

1.El acuerdo de que el aprendizaje es estratégico no siempre se sustenta en hechos

2. La creación de una nueva cultura de aprendizaje debe ser más programática

3. Falta una perspectiva amplia y sistemática de la cooperación interinstitucional

4.El uso de oportunidades que brindan las nuevas tecnologías sigue siendo aleatorio e inconsistente

5.El aprendizaje electrónico puede interpretarse como un paso hacia la agilidad de las organizaciones de Naciones Unidas

6.Es necesario un mayor compromiso y compromiso por parte del propio personal

7.Cómo avanzar hacia un sistema de aprendizaje de las Naciones Unidas: tres vectores

El primer vector está relacionado con las políticas: el desarrollo de un marco de aprendizaje institucional de las Naciones Unidas visionario y estratégico a nivel de todo el sistema, que debe abarcar principios y acciones basados ​​en los valores y necesidades comunes de todas las organizaciones interesadas de las Naciones Unidas.

El segundo vector es institucional: la mejora y consolidación del papel de la Escuela Superior del Personal del Sistema de las Naciones Unidas como institución de aprendizaje y gestión del conocimiento a nivel de todo el sistema, mediante el fortalecimiento de su mandato y la mejora de sus recursos.

El tercer vector es de naturaleza operativa: un uso coordinado, más riguroso, sistemático y pragmático de las plataformas de aprendizaje electrónico, incluidas las plataformas conjuntas.

Written by cplysy · Categorized: TripleAD

Aug 18 2020

How to Design Reports that Actually Inform Decisions

I used to write hundred-page reports… I was trained to write lengthy reports filled with statistical jargon. Important information sat around and gathered dust.

Now, I design reports that people actually want to read. Fewer paragraphs. More graphs. My audience can understand the information, so the data actually gets used.

Ann K. Emery will teach you how to write engaging reports.

Reports aren’t supposed to feel daunting.

We’ll walk through my Report Redesign Pyramid, a step-by-step process that you can apply to your own projects.

You’ll learn how to:

  • match your dissemination format’s complexity to your audience;
  • follow the 30-3-1 approach;
  • design a one-pager with my seven ingredients;
  • set up your Theme Colors and Fonts inside Word;
  • use landscape for on-screen reading;
  • add a 20-minute cover;
  • visually chunk content with dividers;
  • apply a text hierarchy;
  • start with the “so what?;”
  • aim for 1+ visual per page;
  • add 15+ styles of visuals using my checklist;
  • go beyond the bar chart;
  • lower the reading grade level of your writing; and
  • tell a story through dark-light contrast and takeaway text.

What’s included in this training program?

I’m going to transform you into the report-redesigning hero that your organization needs. Here’s what’s included to make that happen.

  • 30+ video lessons that you can watch anytime (the equivalent of my two-day Report Redesign workshop)
  • Step-by-step process to transform Dusty Shelf Reports into reports that actually inform decisions
  • 2 Office Hours sessions every month to talk about your projects and hear from guest speakers
  • 6 additional Live Trainings just for participants in this program
  • 60-page Report Redesign ebook with our checklists and case studies
  • Discussion boards to ask questions and post your own work
  • Private Facebook community of fellow participants
  • Weekly emails to cheer you on
  • Lifetime access so you don’t feel rushed
  • Examples from a variety of industries (public health, juvenile justice, museums, and more)
  • Behind-the-scenes Word and PowerPoint magic tricks guaranteed to make your jaw drop

Who This Training is For

This training IS for those of us who work on reports and one-pagers ourselves. This course is NOT for supervisors who delegate all their report production to someone else. (Supervisors, enroll your staff. Ask me about group rates.)

This training IS for people using everyday software like Excel, Word, and PowerPoint. This course is NOT for graphic designers who exclusively use Adobe Illustrator or Acrobat.

30+ Video Lessons

You’ll get instant access to 30+ lessons–the equivalent of a two-day training. You can watch these lessons anytime around your own schedule.

Office Hours Twice a Month

We’ll even provide feedback on your projects. You’ll get instant access to recorded lessons that you can watch anytime and two live Office Hours sessions every month to get targeted feedback on your reports.

Guest Speakers in Office Hours

Sometimes we invite guest experts to speak with us during Office Hours. You’ll be able to access recordings from our sessions with Elizabeth Grim (about Connecticut’s COVID-19 response), Ione Farrar (about Tennessee’s COVID-19 response), Brenna Butler (about user experience), Chris Lysy (about using data for social action), and Sara Vaca (about visualization qualitative data).

By Popular Demand! 6 Live Sessions

Office Hours are open to everyone who’s taking online courses with me. By popular demand, we’ll also hold six additional Live Trainings just for the participants in this course.

  1. Tuesday, August 25, 2020 from 4 – 5 pm EST: Orientation Session & Self-Assessment
  2. Tuesday, September 29, 2020 from 4 – 5 pm EST: Emily Mills, author of The Art of Visual Notetaking
  3. Tuesday, October 27, 2020 from 4 – 5 pm EST: Kathleen Oh, breathwork session
  4. Tuesday, November 24, 2020 from 4 – 5 pm EST: Redesigning your reports together (first 5 participants to register will be eligible to have their reports used as case studies)
  5. Tuesday, December 29, 2020 from 4 – 5 pm EST: Redesigning your reports together (first 5 participants to register will be eligible to have their reports used as case studies)
  6. Tuesday, January 26, 2020 from 4 – 5 pm EST: Graduation Party

The sessions will be recorded in case you can’t make it live.

60-Page Report Redesign Ebook

You’ll get a license to download our 60-page ebook, which contains our 7 Ingredients for Designing One-Pagers, Checklist of 15+ Ideas for Visuals, and additional reporting case studies. This ebook is only available for participants in the Report Redesign full course and is not available anywhere else.

Discussion Boards to Ask Questions

Every module includes discussion boards where you can ask questions, comment on the lessons, and share your own tips with the community.

Private Facebook Community of Fellow Participants

You’ll be invited to join our private Facebook community, where I offer additional Facebook Lives. You can also post your own questions and get feedback from me and from your colleagues.

Weekly Emails to Cheer You On

I know you’re going to skip straight to the juicy reporting magic tricks, but I’m going to email you on Mondays around 11 am EST and pretend like we’re working through the course one module at a time.

Once-a-Year Registration

Mark your calendars! This course only opens once a year for registration. The 2020 enrollment window is Monday, August 17th through Friday, August 21st. When it’s open, it’s open. When it’s closed, it’s closed.

We’ve also got special Early Bird Bonuses for the earliest registrants.

First 25 People

The first 25 people to register will receive a Swag Bag with a dataviz shirt, stickers, buttons, and magnets.

First 10 People

The first 10 people to register will ALSO receive verbal feedback on their graph, report, dashboard, or infographic. I’ll spend 15-20 minutes talking through everything you’re already doing well, and then give you a couple priority areas to focus on the next time you design a report like this. The feedback will be recorded and posted as a case study inside the course.

First 5 People

The first 5 people to register will ALSO receive a report makeover. You’ll send me your report. Then, I’ll work on it directly for ~30 minutes during one of the Live Trainings with the 2020 cohort. This is a great opportunity to have me consult on your project.

3,620+ participants from around the globe

have already taken the leap into better reports, slideshows, dashboards, and infographics by participating in our online courses.

Your Instructor

Ann K. EmeryAnn K. Emery

Each year, I lead dozens of in-person workshops for thousands of people. My online courses bring those skills to you, too.

Depict Data Studio also consults to the United Nations, State Department, and Centers for Disease Control, plus dozens more foundations, nonprofits, film companies, banks, hospitals, and universities worldwide.

Your data deserves to be out in the world–actionable, talked about, used–not gathering dust in spreadsheets.

What does an online course look like inside?

I talk with you like a real person, not a monotone robot reading off a boring script.

What Participants Are Saying

“Before this course, I was visualizing data in all the wrong ways. We had such compelling data, but it wasn’t telling a story– it wasn’t coming alive. Ann’s course really helped me transform my data and reports. I utilize the skills from this course every day— when developing reports and papers, doing dashboards for my team, and presentations. I have begun to develop a reputation within my department, as well as from other departments, for making compelling reports and having a knack for data visualization. In turn, I always recommend this course. This course has even helped me become better at data analytics and even data collection and survey writing, because you can better visualize the data that you want to see. The course has been an amazing resource, and the fact that you have access to it indefinitely is astounding. If you’re on the fence, take the leap! It’s worth it!”

– Padraic Stanley, Program Coordinator, Rush University Medical Center

Frequently Asked Questions

How long do I have access to the course?

Indefinitely. I used to limit access to just 12 months. I wanted to encourage you to get in here and learn with me, but instead it just stressed you out, so I’m not cutting off your access anymore.

Can’t I just find this information on the internet or in books?!

No. I’ve given workshops and webinars on Report Redesign, but you won’t find these techniques in books, blogs, or on YouTube anywhere.

I know you’re a perfectionist and always update your courses.

Yes, and you’ll receive all future updates to this course.

What if I am unhappy with the course?

Contact us in the first 30 days and we will give you a no-questions-asked full refund.

Register by Friday, August 21, 2020

  • $747 USD one-time purchase
  • 3 payments of $249
  • 6 payments of $125

See you in the course!

— Ann K. Emery

Written by cplysy · Categorized: depictdatastudio

  • « Go to Previous Page
  • Go to page 1
  • Interim pages omitted …
  • Go to page 243
  • Go to page 244
  • Go to page 245
  • Go to page 246
  • Go to page 247
  • Interim pages omitted …
  • Go to page 310
  • Go to Next Page »

Footer

Follow our Work

The easiest way to stay connected to our work is to join our newsletter. You’ll get updates on projects, learn about new events, and hear stories from those evaluators whom the field continues to actively exclude and erase.

Get Updates

Want to take further action or join a pod? Click here to learn more.

Copyright © 2026 · The May 13 Group · Log in

en English
af Afrikaanssq Shqipam አማርኛar العربيةhy Հայերենaz Azərbaycan dilieu Euskarabe Беларуская моваbn বাংলাbs Bosanskibg Българскиca Catalàceb Cebuanony Chichewazh-CN 简体中文zh-TW 繁體中文co Corsuhr Hrvatskics Čeština‎da Dansknl Nederlandsen Englisheo Esperantoet Eestitl Filipinofi Suomifr Françaisfy Fryskgl Galegoka ქართულიde Deutschel Ελληνικάgu ગુજરાતીht Kreyol ayisyenha Harshen Hausahaw Ōlelo Hawaiʻiiw עִבְרִיתhi हिन्दीhmn Hmonghu Magyaris Íslenskaig Igboid Bahasa Indonesiaga Gaeilgeit Italianoja 日本語jw Basa Jawakn ಕನ್ನಡkk Қазақ тіліkm ភាសាខ្មែរko 한국어ku كوردی‎ky Кыргызчаlo ພາສາລາວla Latinlv Latviešu valodalt Lietuvių kalbalb Lëtzebuergeschmk Македонски јазикmg Malagasyms Bahasa Melayuml മലയാളംmt Maltesemi Te Reo Māorimr मराठीmn Монголmy ဗမာစာne नेपालीno Norsk bokmålps پښتوfa فارسیpl Polskipt Portuguêspa ਪੰਜਾਬੀro Românăru Русскийsm Samoangd Gàidhligsr Српски језикst Sesothosn Shonasd سنڌيsi සිංහලsk Slovenčinasl Slovenščinaso Afsoomaalies Españolsu Basa Sundasw Kiswahilisv Svenskatg Тоҷикӣta தமிழ்te తెలుగుth ไทยtr Türkçeuk Українськаur اردوuz O‘zbekchavi Tiếng Việtcy Cymraegxh isiXhosayi יידישyo Yorùbázu Zulu