• Skip to main content
  • Skip to footer
  • Home

The May 13 Group

the next day for evaluation

  • Get Involved
  • Our Work
  • About Us
You are here: Home / Archives for allblogs

allblogs

Aug 01 2023

Report Study – Goalkeepers 2022

In this series of blog posts I will share examples of professionally designed modern reports. For each report I’ll also write out a list of things to notice. My goal is not to critique but to show you real life examples of design concepts to help you become a better report designer.

First up, the 2022 Goalkeepers Report put out by Bill & Melinda Gates Foundation.

To get the most out of this post I suggest opening the report in another browser tab so you can bounce and forth as your read this post.

Bill and Melinda Gates Foundation Goalkeepers 2022 Report (Header Screenshot)

1. Notice the Tiny Header and Subheader

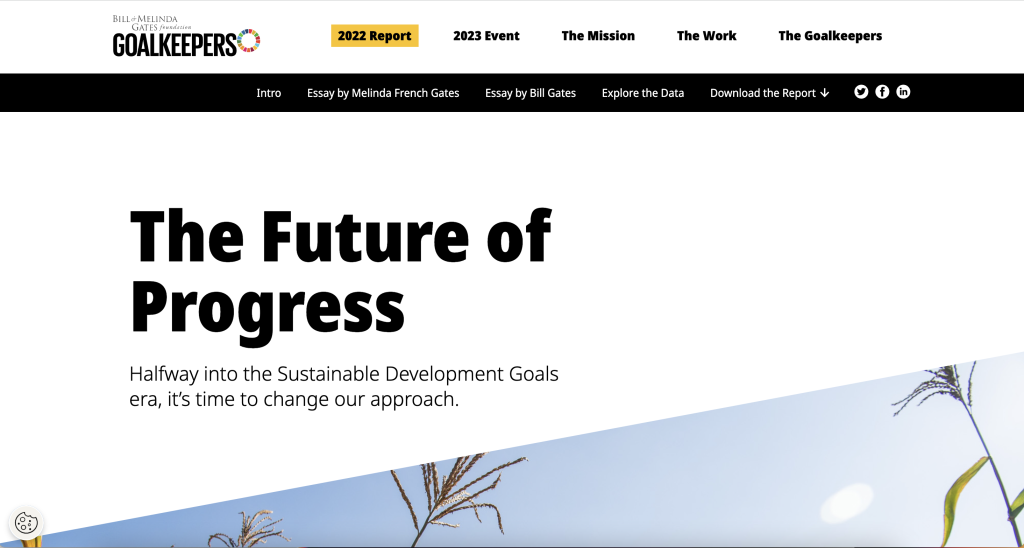
Notice how they didn’t mention “Goalkeepers,” in the report header or use the word, “Report.”

They didn’t need to. The report lives on the Goalkeepers page under the 2022 Report heading. So instead, they could put something simpler. Not quite sure what “The Future of Progress” means but the subheader, “Halfway into the Sustainable Development Goals era, it’s time to change our approach,” really sets up the report.

2022 Goalkeepers Report Intro section screenshot.

2. You are not forced to read the full introduction.

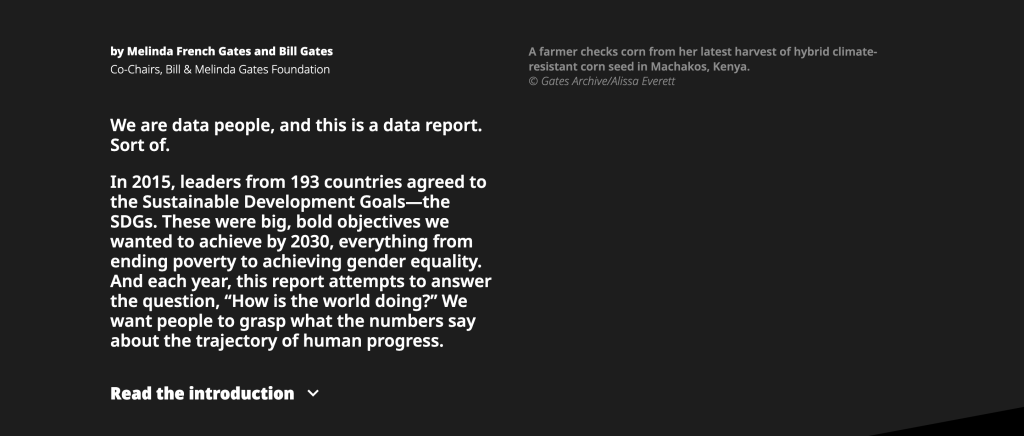
This report introduces a lot of choice. It gives you a paragraph of introduction, but if you want to read more, you have to click the expandable link for “Read the introduction.”

This is not the only time the report does this. Both featured essays are also only provided if you click to read. So right away the report feels more like the front page of a modern blog or newspaper than something you have to scroll through.

Screenshot of the Goalkeepers Report Essay Section.

3. The left column is for the narrative.

There is a principle in design called “continuation.”

Basically, when you share something to read you want it to flow. If you constantly move your paragraphs around the page or break it up constantly with pictures and charts, it will stop feeling like something to read.

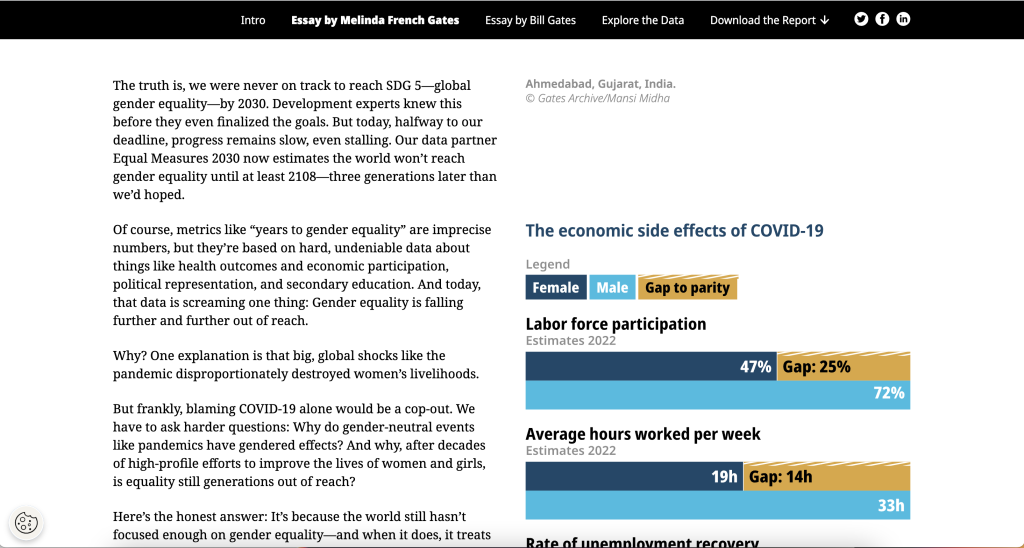
Across the intro and essays there is a two column setup with ample white space surrounding the columns. But only the left column contains the narrative. In the right column you’ll find charts, photo captions, and occasional photos. In this way, the page is broken down so you can easily read through the narrative.

As a bonus, since the narrative takes up very little space on the page, there isn’t a huge difference between how it reads on the web as to how it would read on a phone. This is increasingly common. For example, go check out a news site like the NY Times and notice how little landscape the column of narrative actually takes up.

Screenshot of the Goalkeepers report Explore the Data section.

4. Look at how the data exploration takes advantage of repetition.

One of the mistakes amateur report creators make all the time is that they think every single new chart needs to be different from the last chart. You know, “to keep it fresh.”

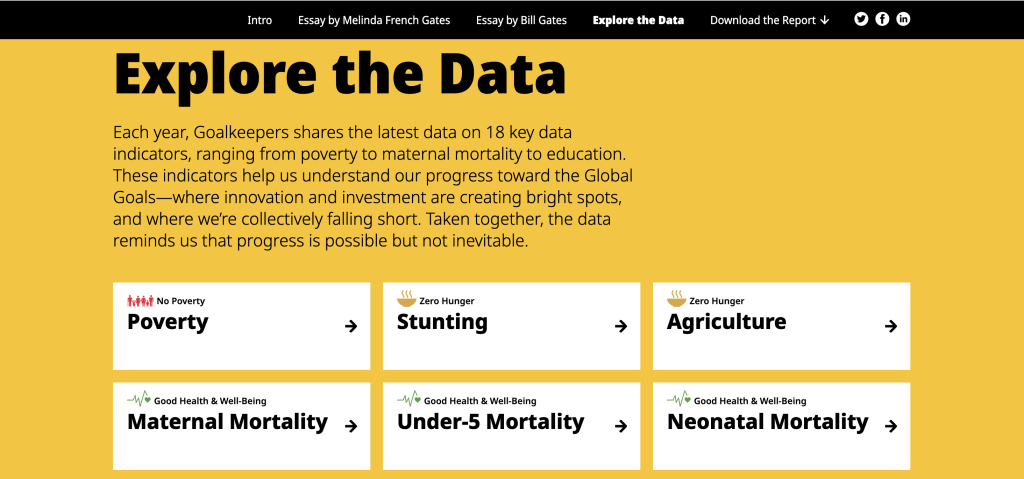
But there is also a comfort in repetition, especially when you are looking at different indicators. Click around the different indicators in the “Explore the Data” section. Notice how they use the same chart types over and over and over again.

This lets you view the charts for the data, and not have to relearn how each specific chart is supposed to work on every page.

Screenshot of the Goalkeepers Report PDF.

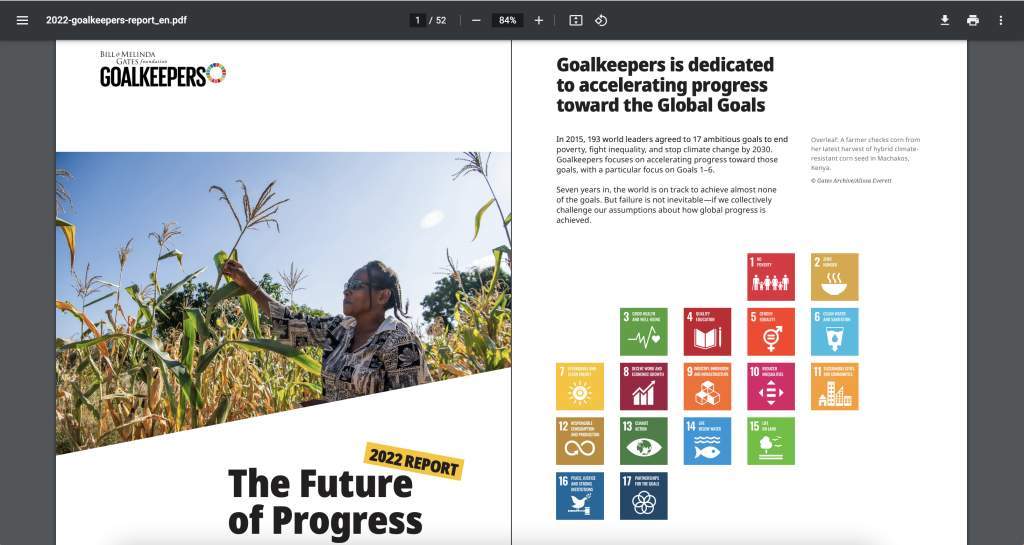
5. Check out the changes made in the PDF version.

Like many modern reports created by larger organizations, there is also a downloadable PDF. You get to it by clicking “Download the Report.”

Look at how the PDF compares to online version. Ask yourself what’s the same and what’s different? Personally, I really like how they kept the repetition in the “Explore the Data” section. Each indicator is given its own page, even if that means a bit of white space.

I also like how the Sources and Notes section isn’t just a list of reference links. There are narrative style notes and explanations shared within the section.

What are your takeaways?

Did you check out the report? Anything interesting catch your eye? If yes, leave a comment and let me know what you noticed.

Written by cplysy · Categorized: freshspectrum

Jul 31 2023

A picture is worth a thousand words: Photovoice

This article is rated as:


We all know the standard data collection tools in an evaluator’s methodology toolkit: surveys, interviews, focus groups, document review, and maybe even observation. But we also know there is a world of other methodologies out there like participatory and arts-based methods. Photovoice is one of those. I’ll admit, as a veteran evaluator I find myself in the rut of sticking with the tried-and-true methods, perhaps a little too much. In my career, I’ve actually only ever used Photovoice once, and it was on a collaboration project when another evaluator encouraged its use. Although it can be intimidating to try something new, Photovoice (and all those other methods) hold a valuable place in our toolkits and deserve to be used more often than they are.


What is Photovoice?

Photovoice is a qualitative method that uses participant perspective to capture meaningful insights of their lived experience through photography. Usually, the photographer is guided by some prompting questions from the evaluator, and the images are accompanied by a caption or short narrative from the photographer. Together the photo and the narrative tell a story from the perspective of the participant.

Photovoice is considered an accessible data collection method, with limited literacy or language barriers. As such, it is suitable for use among marginalized populations, and with varying age groups, education levels, and abilities.

Photovoice was first developed by Wang and Burris in 1997, who sought to develop a data collection method that would empower participants, invite critical dialogue, and be accessible to change-makers. Photovoice has the potential, and arguably intention, to spur public awareness, reach policymakers, and foster accountability. It has the added benefits of providing a voice to often underrepresented populations and facilitating reflection while empowering individuals.


How to use Photovoice

If you’ve decided to use Photovoice in your evaluation, consider a few things:

  • How likely is it that your participants will have access to a device to take photos (e.g., phone, camera, tablet)? If this is unlikely, how can you facilitate access?

  • How likely is it that your participants will know how to take a photo? If this is unlikely, is there training you’ll need to incorporate?

  • How likely is it that documenting a lived experience may trigger a trauma response in your participants? How can you promote a trauma-informed approach?

In all cases, you’ll want to carefully consider informed consent and ethical use of data.

The informed consent should explain to participants how their photos will be used and who they will be shared with. For example, will there be a public exhibit of the photos? Will the photos be included in reporting?

All participants should have access to some sort of training around appropriate photos. For example, participants should not put themselves in dangerous situations to get a photo. There should be a frank discussion about photographing other people, as they may not have consented to the use of a photo of themselves. Often Photovoice projects will discourage photos of faces.

Once you have your logistics planned, invite your participants to learn about Photovoice. This is likely a session facilitated by the evaluator where you would explain what it is, why you’re using it, and give the opportunity for participants to ask questions.  A handout or one-pager may be helpful, especially if it includes examples. Using Photovoice means you’ll need several connection points with your participants, unlike a one-time interview or focus group. Be clear about the time commitment involved.

As mentioned, usually Photovoice is accompanied by some questions. Depending on the scope of your project, you may want to limit this to less than five questions. These questions could be prompts for your photographers to consider, for example, “What has been the biggest change?” or “What is most impactful?”, or they can be more specific questions, for example, “Take a photograph that shows me a key enabler to this change” or “What has been positive about your experience in using this program or service?”


Art Walk

One of the unique aspects of Photovoice is the option to do an art walk (aka gallery walk, exhibition). Should you have the luxury of all being in the same geographic location this can be done in-person, but you can also set up a virtual art walk. In an art walk, you can showcase the photos and accompanying narratives to all participants collectively. Participants explore other points of view and come together for a discussion. This discussion should be facilitated by the evaluator, likely with some pre-determined questions, for example, “What stood out to you?”, “What did you notice about others’ perspectives?”, “What was the same/different?”, and “Did you notice any patterns or themes?”

It is critically important that an art walk is set up with a trauma-informed lens, creating an environment that is non-judgmental, inclusive, accessible, and respectful. All participants should know exactly what to expect, including whether they will be asked to speak about their photo(s).

This art walk and subsequent discussion are yet another source of information for your evaluation. The discussion, in particular, is a form of participatory data analysis (while the act of taking photos is a form of participatory data collection).


Analysis

Photos can be analyzed in the way you would other qualitative pieces. Many software programs allow you to input photographs and add codes to sections of or the whole photograph. The accompanying narrative or description should also be included in your coding. The discussion from the art walk may help you to form a deductive approach to this analysis.

A caution in the analysis of Photovoice relates to interpretation: the photos and narratives represent the lived experience of one individual and may not be representative of or generalizable to a group. The evaluator or analyst will need to exercise caution not to code the photographs or narratives using their own interpretation and biases, but to attempt to retain the voice of the photographer. Member checking may be useful here.


Reporting

In many evaluations, Photovoice would be one of many methods of a broader evaluation; the results and learnings from Photovoice would be incorporated into your reporting or knowledge translation deliverables. Of course, the photos can be used in your reporting so long as you were explicit in seeking that consent ahead of time.

Sometimes I think of Photovoice as similar to Most Significant Change methodology; the information you are getting may not be as detailed as you might get in a one-on-one interview, but you are getting the information that your participants are telling you matters the most – the biggest change, the top priority, the lived experience.  Photovoice explores context, not depth.


I’m still a newbie to Photovoice and would love to hear about your experiences with using Photovoice! When have you used it and how has it helped?

Written by cplysy · Categorized: evalacademy

Jul 31 2023

New infographic: Data viz decision tree

This article is rated as:


Eval Academy just released a new infographic, “Data Viz Decision Tree”


Who’s it for?

Choosing the right type of chart to display your data can help to improve clarity among your readers and lessens the likelihood that your findings may be misinterpreted. With so many different types of charts and graphs, it can be tough to know where to start. This infographic is for anyone who wants to clearly display their quantitative data in a meaningful way but isn’t sure how to pick the best chart for the job.


What’s the purpose?

This infographic prompts readers to ask themselves questions about the data they want to display and provides chart and graph types to visualize their data appropriately based on their answers. Although not an exhaustive list of all possible visualizations, this resource covers many of the charts and graphs we use most in our own evaluation work, with use case examples for context.


What’s included?

A clickable and printable infographic to help you choose the best chart for your data set, as well as one-page summaries and use case examples of the sixteen most-used charts and graphs in our own work, including:

  • Mosaic Charts

  • Grouped Scatter Plots

  • Bubble Graphs

  • Correlation Heatmaps

  • Simple Line Graphs

  • Waterfall Charts

  • Multiple Line Graphs

  • Area Graphs

  • Simple Bar and Column Charts

  • Gauge Charts

  • Stacked Bar and Column Charts

  • Pie, Donut, and Waffle Charts

  • Treemap Charts

  • Funnel Charts

  • Scatter Plots

  • Dumbbell Charts 


Keep an eye out for our upcoming article on data viz!


You can learn more about charts and presenting data on Eval Academy through the following links:

  • 7 tips for better data visualizations

  • Video: How To Create a Visually Impactful Column Chart

  • Dial down your data

  • Chart Templates: The Time Saver You Should Be Using


 What do you think of our new infographic? Let us know in the comments below!

Written by cplysy · Categorized: evalacademy

Jul 31 2023

Creating a Qualitative Codebook

This article is rated as:


What is a codebook?

A codebook for qualitative research is a stand-alone document that contains a list of themes, codes, and definitions that you are using in your qualitative analysis. A codebook helps to keep the entire team on the same page about the qualitative analysis and supports turning your analysis into a clear summary, where you can easily add or consolidate details as needed. A codebook can be used with both inductive and deductive coding approaches. In inductive coding, you aim to develop a theory or develop codes and themes as you go. With deductive coding, you aim to test an existing theory, meaning you have a coding structure developed in advance.

Having a codebook can help you keep track of themes and codes, especially when you have multiple coders or emerging themes. While some qualitative analysis software provides you with a space to include the information contained within a codebook, the information isn’t all contained in one place. Having a separate codebook allows you to have one easily updatable document that contains all the information in one place. I like to keep my codebook open in a separate tab while I am coding regardless of whether I’m coding in fancy software or in Excel or Word.

I like to build my qualitative codebook in Excel, adding columns and rows to fit whatever analysis I’m completing. Typically, my codebooks start with the same 4 key components:

  • Theme and code headings

  • Code definition and description

  • Examples or key quotes

  • References to source documents


How to create a codebook

To help you understand how to create and use a codebook, I’ll walk through each of these key components, then provide you with two examples.


 Theme and code headings

The first few columns in my codebook are dedicated to the theme, subtheme (if necessary) and code. Each row in the codebook is dedicated to one code. If you are using a deductive coding approach, you would build these columns and rows into your codebook before you start coding, populating the themes and codes in advance.


 Code definition and description

Next up are the code definition and description columns. Sometimes I just create one combined definition and description column, but in more detailed projects it is helpful to keep them separate. With a deductive coding approach, you can complete the code definition column in advance, while if you are taking an inductive approach, you will complete these as you go. Codes should be clearly defined to avoid overlap between codes. Even with a deductive coding approach, the definition of what is included in each code will likely evolve over time or need clarification as you dive into coding. When coding as a group, the group should discuss all changes to code definitions before they are made. The code description section is where you can jot down some high-level details of what you are finding within the code. This section also helps you summarize your findings and write your reports. Just remember, the code definition is where you put what the code is about, while the code description is where you put the details of what you are finding in each code.


 Examples or key quotes

This section is where I put high-quality examples of findings in a code. Sometimes I have an ‘examples’ column and a ‘quotes’ column and sometimes just one column will do. Make sure to include references to your source documents (e.g., which interview or focus group the quote came from) when including quotes in these columns.


 References

This is one of the most subjective sections that will vary from project to project, but typically I use this space to indicate which interviews or focus groups the code was discussed in. If I’m analyzing interviews or focus groups that fall into different categories, you can use the reference columns to indicate whether the code was discussed in each category or not. If your code doesn’t include directionality (e.g., a code about “wait times” doesn’t indicate if the discussion was positive or negative) it can be helpful to note if certain groups discussed the code in different ways. This section can also help you quantify your qualitative data if necessary (see our “How to Quantify Qualitative Data” and “3 Easy Ways to Quantify Your Qualitative Data” articles for more on this!).


 Example Codebooks

Here are two example codebooks to help you understand how the excel sheets can be set up and tailored to your specific analysis.


Example 1

In the first example, the Examples column is used for lengthier, more descriptive quotes or examples, while the Quotes column contains the shorter, punchier quotes that I might want to include in a report. The References section highlights which groups discussed the code and specifically denotes which focus groups the code was referenced in.


 Example 2


In the second example, the Examples column serves as both the Examples and Quotes column. The References section shows which focus groups the code was discussed in and the directionality of the discussion (positive or negative). In Example 2, the focus groups may have been heterogenous, and included a mix of all participants, hence the sub-columns were unnecessary.


While codebooks are useful tools to support your qualitative analysis, they don’t help you understand how to code. If you are looking for more resources to help you learn about qualitative coding, check out some of our articles:

–       Definition of qualitative analysis

–       Definition of thematic analysis


 Let us know if you have other questions about qualitative analysis that we can help answer!

Written by cplysy · Categorized: evalacademy

Jul 31 2023

New infographic: 10 tips for running a focus group

This article is rated as:


Focus groups are a valuable method of qualitative data collection in evaluation, enabling in-depth exploration of participant perspectives, experiences, and opinions. By leveraging group dynamics and interactions, focus groups provide a platform for participants to build on ideas, challenge assumptions, and generate new insights. In this article, we present our top tips for running successful focus groups that are efficient and gather quality data. You can download the infographic here.


  1. Plan and prepare by defining objectives and creating a discussion guide.

Before organizing your focus group, take some time to clearly define the purpose and objectives of the group. Determine the specific information or insights you aim to gather from participants and articulate the evaluation questions or topics you want to explore.

You will also want to develop a detailed plan that outlines the logistics, including the number of sessions, duration, location, and participant recruitment criteria. This will ensure a well-organized and smoothly executed focus group.

You will also want to prepare a discussion guide that serves as a roadmap for the conversation. Discussion guides can be structured, semi-structured, or unstructured. The guide should outline the key topics, questions, and prompts you want to cover during the focus group to keep the discussion focused and on track. Check out our focus group moderation guide to help plan and prepare for your next focus group: https://www.evalacademy.com/resources/focus-group-moderation-guide-template

2. Recruit participants. Pay close attention to potential group dynamics and power imbalances.

When recruiting participants for your focus group, select individuals who align with your target audience or possess relevant experiences and perspectives. It can be beneficial to include a diverse group of participants to obtain varied insights. The focus group can be comprised of individuals from different backgrounds, perspectives, and experiences related to the topic to ensure a richer discussion and minimize bias. One of the main values of a focus group is that participants can respond to what others are saying; they get to hear others’ perspectives and agree or disagree. However, it is important to be aware of potential power imbalances amongst your focus group participants. For instance, when conducting a focus group to explore perceptions of insecurity between managers and staff, including participants from both managerial and staff positions in the same group may create a reluctance among individuals to express their thoughts openly in front of one another.

Select a focus group time that you think will work best for participants and send the invites as early as possible to decrease scheduling conflict and allow participants to prepare for the discussion.

To facilitate meaningful discussions, aim for a group size of 3 to 8 participants. Smaller groups allow for deeper engagement and individual participation, while larger groups can be more challenging to manage and may restrict individual contributions. You can learn more about sampling and recruitment on Eval Academy here: https://www.evalacademy.com/articles/sampling-and-recruitment-101


3. Create a welcoming environment conducive to open discussion and take time to build rapport. 

Whether meeting in person or online, set up a comfortable space that promotes open discussion. In a physical setting, arrange seating in a circle or semi-circle to encourage eye contact and engagement. Choose a neutral and private venue, such as a dedicated focus group facility or quiet meeting room. For online meetings, advise participants to find a quiet and comfortable location with minimal distractions, and encourage camera usage (if they are comfortable to do so) to enhance personal connection.

Establish rapport by beginning the session by introducing participants and engaging in icebreaker activities. These activities will create a comfortable atmosphere, help to make group members feel at ease, and foster a positive and collaborative environment.


4. Establish ground rules to encourage honest conversation, including confidentiality measures.

Set clear ground rules at the beginning of the session that emphasize respect, active listening, and open dialogue. Encourage participants to freely express their honest opinions. Assure participants that their responses will be confidential, and their personal information will be protected. Obtain informed consent for their participation and adhere to privacy standards. You can learn more about consent on Eval Academy and access our Focus Group Information Letter and Consent Form to use in your next focus group. By creating a safe and confidential space, participants will feel comfortable engaging in open and honest discussions.


5. Record and document with the participant’s consent.

Consider recording the focus group with participants’ consent to alleviate the need for extensive notetaking and allow you to focus on facilitating the discussion. Ensure all participants are comfortable with the conversation being recorded before proceeding. It can be helpful to ask a colleague to join the focus group as an assigned notetaker, particularly if consent is not given to record the conversation. The notetaker should document key points, participant responses, non-verbal cues, and any noteworthy interactions, including power dynamics. These comprehensive notes will be instrumental for later analysis and reporting purposes.


6. Act as a facilitator as opposed to a conversation leader. Practice active listening.

Foster an open and non-judgmental discussion by asking open-ended questions and encouraging participants to freely share their thoughts and experiences. Frame questions in an open-ended format, avoiding leading or biased prompts that may sway responses. Utilize probing techniques to delve deeper into their responses. Remember, as the facilitator, your role is to guide rather than lead the conversation. Your goal is to steer the discussion, encourage participation, and manage conflicts or dominant voices. Practice active listening, paying attention to both verbal and non-verbal cues. Demonstrate genuine interest and engagement by asking follow-up questions and seeking clarifications.


7. Manage group dynamics.

Take measures to ensure equal participation among participants by effectively managing dominant or shy individuals. Encourage quieter participants to express their opinions while carefully preventing any individual from monopolizing the conversation. Address dominant participants by gently redirecting the conversation and inviting quieter individuals to share their perspectives. This will help to create an environment where all participants have an equal opportunity to contribute their insights. Employ effective moderation techniques to maintain focus and stay within the allotted time. For example, redirect tangential discussions and ensure that all planned topics are adequately covered.


8. Be adaptable and allow for flexibility in conversation.

Maintain adaptability during the focus group session, allowing the conversation to naturally evolve and adjusting the discussion guide as necessary. Embrace the potential for unexpected insights and ideas that may arise during the discussion as long as the discussion stays on topic. Stay open-minded and receptive to new perspectives, allowing for a dynamic and organic conversation.


9. Summarize and validate with participants.

Summarize the key points raised by participants and seek their validation to ensure accuracy and demonstrate respect for their input. This process helps you verify your understanding of their perspectives and ensures that their voices are accurately represented. If participants share highly sensitive and private information during the session you can offer them an opportunity to see the results and reports before they are finalized to ensure anonymity and accuracy. See our article on Member Checking: https://www.evalacademy.com/articles/what-you-need-to-know-about-member-checking. By actively involving participants in the validation process, you foster a collaborative and inclusive environment that values their contributions.


10. Be appreciative and consider remuneration.

Show your gratitude to the participants for their time and valuable contributions at the conclusion of the focus group session. Take a moment to thank each participant individually after the session to acknowledge their valuable insights and perspectives. Consider providing incentives as a gesture of gratitude for their involvement and willingness to share their experiences. This expression of appreciation reinforces the importance of their contribution and fosters a positive relationship for future engagements. You can learn more about incentives for participation in evaluation here: https://www.evalacademy.com/articles/incentives-for-participation


Lastly, it is important to reflect on the focus group process after its completion and gather feedback from participants and anyone else supporting the facilitation process. Use this feedback to improve future focus groups.


Have you facilitated a focus group? What are your top tips for ensuring a successful data collection activity? Comment on this article or connect with us on LinkedIn or Twitter! 

Written by cplysy · Categorized: evalacademy

  • « Go to Previous Page
  • Go to page 1
  • Interim pages omitted …
  • Go to page 79
  • Go to page 80
  • Go to page 81
  • Go to page 82
  • Go to page 83
  • Interim pages omitted …
  • Go to page 310
  • Go to Next Page »

Footer

Follow our Work

The easiest way to stay connected to our work is to join our newsletter. You’ll get updates on projects, learn about new events, and hear stories from those evaluators whom the field continues to actively exclude and erase.

Get Updates

Want to take further action or join a pod? Click here to learn more.

Copyright © 2026 · The May 13 Group · Log in

en English
af Afrikaanssq Shqipam አማርኛar العربيةhy Հայերենaz Azərbaycan dilieu Euskarabe Беларуская моваbn বাংলাbs Bosanskibg Българскиca Catalàceb Cebuanony Chichewazh-CN 简体中文zh-TW 繁體中文co Corsuhr Hrvatskics Čeština‎da Dansknl Nederlandsen Englisheo Esperantoet Eestitl Filipinofi Suomifr Françaisfy Fryskgl Galegoka ქართულიde Deutschel Ελληνικάgu ગુજરાતીht Kreyol ayisyenha Harshen Hausahaw Ōlelo Hawaiʻiiw עִבְרִיתhi हिन्दीhmn Hmonghu Magyaris Íslenskaig Igboid Bahasa Indonesiaga Gaeilgeit Italianoja 日本語jw Basa Jawakn ಕನ್ನಡkk Қазақ тіліkm ភាសាខ្មែរko 한국어ku كوردی‎ky Кыргызчаlo ພາສາລາວla Latinlv Latviešu valodalt Lietuvių kalbalb Lëtzebuergeschmk Македонски јазикmg Malagasyms Bahasa Melayuml മലയാളംmt Maltesemi Te Reo Māorimr मराठीmn Монголmy ဗမာစာne नेपालीno Norsk bokmålps پښتوfa فارسیpl Polskipt Portuguêspa ਪੰਜਾਬੀro Românăru Русскийsm Samoangd Gàidhligsr Српски језикst Sesothosn Shonasd سنڌيsi සිංහලsk Slovenčinasl Slovenščinaso Afsoomaalies Españolsu Basa Sundasw Kiswahilisv Svenskatg Тоҷикӣta தமிழ்te తెలుగుth ไทยtr Türkçeuk Українськаur اردوuz O‘zbekchavi Tiếng Việtcy Cymraegxh isiXhosayi יידישyo Yorùbázu Zulu