• Skip to main content
  • Skip to footer
  • Home

The May 13 Group

the next day for evaluation

  • Get Involved
  • Our Work
  • About Us
You are here: Home / Archives for allblogs

allblogs

Apr 27 2022

What’s the difference between goal and objective? The most confusing evaluation jargon

I’ve had many experiences collaborating with other evaluators, colleagues, or program managers starting a new evaluation. Questions fly like “Which evaluation framework will we use?”, “What will our approach be?”, “What is the evaluation plan?”. And often, down in the weeds, we question things like “What are the goals of this project?”, “Is the project achieving objectives?”, “Are there project aims?”. 

That’s a lot of jargon! What do all these terms mean? 

My personal solution to this problem is to be very clear upfront: I am terminology agnostic. I hold no allegiance to any specific term. 


Some people will argue to the death that a goal is a broader concept than an aim, but I guarantee you will meet someone who believes equally as strongly that an aim is overarching with goals nested underneath. 

You will meet people who believe adamantly that an evaluation framework is a validated and tested methodology that guides your approach to a specific evaluation. But you’ll meet others who call their own evaluation plans a framework. Likely in reading this you’ve already identified what side of these debates you fall on.  

For me, no one is wrong. I chose long ago not to have etched-in-stone definitions, but to be fluid to the clients I work with and other evaluators. 

Being agnostic does not mean these definitions don’t matter. They do! It just means I take time to ensure I am on the same page as everyone else in the room so that when we say “goal” we all know what that means and when we say “plan” we all know what that is (and what document to open!).  

Being agnostic also doesn’t mean I don’t have my own preferences, and if given the opportunity I will certainly use the language that makes the most sense to me.

Here are my back-pocket definitions for some of this confusing evaluation language. 


Framework. Plan. Approach. Model.

  • Evaluation Framework

    • This is usually a published methodology – things like RE-AIM, Kirkpatrick, or PRECEDE-PROCEED. 

  • Evaluation Plan

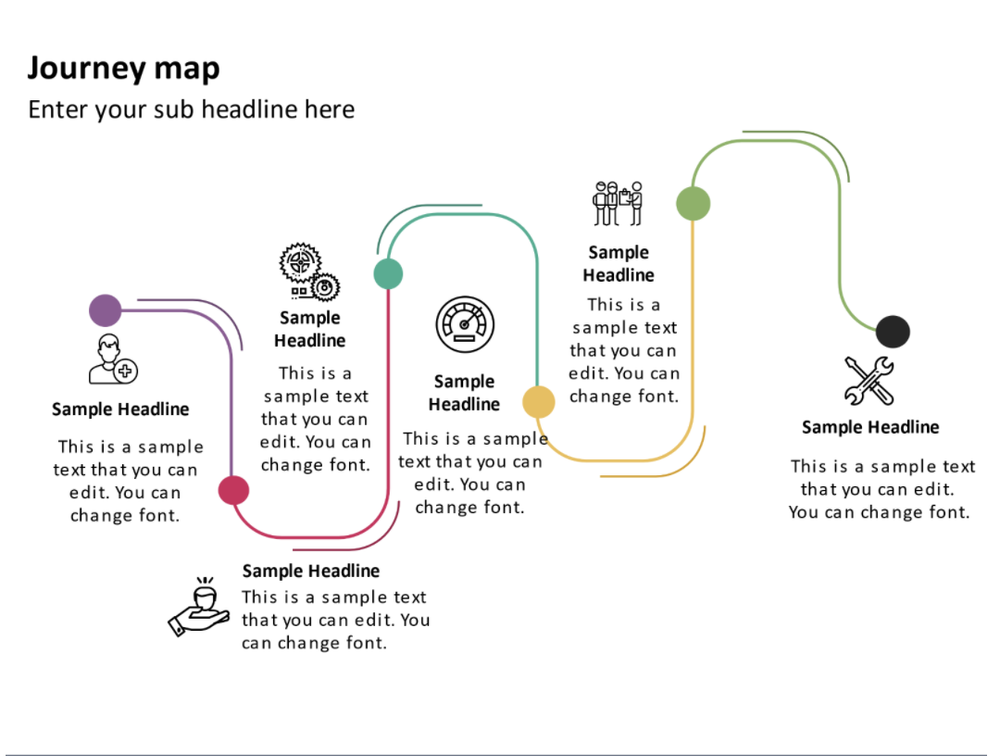
    • This is the document I create, that plans out the evaluation for a given project or program. Check out our template for what goes into creating the plan. 

  • Evaluation approach

    • This is more around guiding principles. For me, I’ll describe approaches as “being utilization-focused”, or “participatory”. You might include things like “summative” or “formative”. 

  • Model

    • For me, most of the language I use is covered with framework, plan, and approach so I don’t tend to use model, but I would align it most closely with Framework. In fact, PRECEDE-PROCEED is actually called a “model”. 

So, when a program manager asks you to “create an evaluation framework”, the first step is confirming if what they mean is for you to create and document a plan that may use a specific evaluative framework. 

When asked which model you may apply to evaluation, you may want to describe both an evaluation approach (e.g., developmental, utilization-focused) and which framework (if any) will be used and confirm that this answers the question. 

The key is ensuring everyone is on the same page. Confirmation without assumption is critical. 

Goal. Aim. Objective. Intended impact. Outcome. Target. Benchmark.

A second grey area, and perhaps an even more common one, is differentiating goals from aims from objectives, etc. For me, these terms are much more interchangeable than the Framework/Plan discussion. Again, the key here is being clear about what terms you use, what they mean and, if relevant, how they link together. 

You may agree that there is some grey area here, but that all the terms I listed are not synonymous. I agree. I do think that targets and benchmarks stand a little apart.

Targets and benchmarks have quantitative metrics associated with them: e.g., “We aim to serve 700 clients in this fiscal year.” Still valid to evaluate, but perhaps not the same as an outcome statement: e.g., “Participants will have increased confidence in accessing support services.”

You could also likely group some of these terms: goal/aim/objective and impact/outcome, for example. The common thread is that in some way each of these terms describes what the program does. 

When I start evaluation planning, I’ll look for all of these terms hiding or disguised in: 

  • Previous evaluation reports and recommendations 

  • Strategic plans 

  • Operational plans 

  • Mission and vision statements 

  • Core values 

  • Guiding principles 

  • Funder requirements/mandates 

I try to align my language to what the program stakeholders use. My goal is to determine what the program is trying to achieve so that we can ask key evaluation questions that drive toward those goals (or outcomes, or objectives, or….). 


What are your preferred terms and what do they mean to you?

At Eval Academy we’re working hard on an evaluation dictionary to help add some clarity to confusing evaluation jargon.

What terms have we missed? Comment on this article and let me know!


Sign up for our newsletter

We’ll let you know about our new content, and curate the best new evaluation resources from around the web!


We respect your privacy.

Thank you!


Written by cplysy · Categorized: evalacademy

Apr 27 2022

3 Easy Ways to Quantify Your Qualitative Data

You’ve completed your qualitative data collection and you’re writing up your report. You step back and look at All. The. Text.  If only you had some quantitative data to include in a chart, or some numbers to report!

We’ve previously written about how to quantify qualitative data and offered some definitions for things like “few” or “some” or “many”. In this article, we’ll give you even more tips for quantifying qualitative data.


  1. Frequencies

    Maybe this is obvious but there’s no rule against counting codes! I will say, though, that this approach may lend itself to data that are addressing a very specific question. “Describe a time you experienced discriminatory behaviour” may be more difficult to quantify than “What is one improvement you’d make to your workplace?”

    I recently coded some data where participants were asked “What was the most helpful part of the program?”

    There were thousands of typed-in responses. I was able to read through it and quickly come up with a list. I could then report that, for example, 40% of respondents thought that flexible scheduling was most helpful, while 30% thought support from the staff was the most helpful.

    Usually there will be an “other” category and that’s okay – just describe what the “other” means: “5% of respondents reported other things, for example, they liked the website, or they liked the snacks at reception.”

    Now you have some numbers to use your data viz skills on!

  2. Demographic descriptions

    You’ve completed all those interviews and are reporting the findings through themes and quotes, but have you explored if there are differences between who said what?

    Maybe there are gender differences in how questions were answered, or role/title differences?

    You could include charts or numbers by reporting something like: “80% of frontline staff but only 20% of managers described a time when they had encountered workplace conflict” or “70% of respondents who lived in a specific geographic region reported more stories of difficulty accessing care compared to only 10% who lived in another region.”

    As always, be cautious about drawing any causation or firm correlations.

  3. Play with data presentation

    Ok, this one may not be quantifying the data per se, but it can break up those text-heavy report pages.

    Word clouds seem to be an oft-used example for visualizing qualitative data. I’ll go out on a limb and say I’m not a fan. I can’t think of a time when I’d gained any meaningful insight from a world cloud.

    Some other options include:

Tables

  • Create a two-column table with your core theme on the left and example quotes on the right.

Journey maps

  • are your participants describing an experience or a narrative? Perhaps you can map it out in stages and include descriptions or quotes at each stage. I’ve found journey maps to be very impactful in reports. You have the option of using one participant as a case study or describing a “typical” experience.

(example maps are free slide templates from SketchBubble)

Images

  • Sometimes something as simple as adding an image, icon or photo along with a quote can make it stand out more and break up the text. Maybe even try a stand-out border.

Icon array

  • If you’ve been able to do any frequencies or counts of your qualitative data, you can certainly include any number of charts to depict your data. An icon array may be particularly impactful to give a visual to how many participants said whatever it is you’re highlighting.


What tips have we missed? Share them by commenting on this article!


Sign up for our newsletter

We’ll let you know about our new content, and curate the best new evaluation resources from around the web!


We respect your privacy.

Thank you!


Written by cplysy · Categorized: evalacademy

Apr 26 2022

Canva Accessibility is bad, here is how you fix your design.

As much as I love Canva, there is definitely one spot where the tool absolutely fails. And that spot is accessibility.

When you work with a lot of government clients the topic of accessibility is almost always at the top of the considerations list when choosing your software. Making your reports accessible to those in your audience with disabilities is certainly the right thing to do. But it can also be a legal imperative.

If you just create a report in Canva and then export to PDF, that report is likely not accessible.

Does this mean you have to stop using Canva?

No way, Canva is still a super useful tool in so many other ways. But you do have to take additional steps after creating your reports to improve your product’s accessibility.

In today’s blog post.

  • Why Canva Fails at Accessibility
  • The Wrong Argument
  • A Canva PDF Example
  • How to run Accessibility Checks on your Canva Report using Adobe Acrobat Pro
  • How to run Accessibility Checks on your Canva Report using Microsoft PowerPoint
  • Tips for making Accessibility easier when designing in Canva
  • If anyone at Canva is reading this post
  • The Accessibility Law (aka Section 508)
  • What makes a website or report accessible?
Accessibility and Canva Featured Image (showing screenshots and icons for Canva, Acrobat, and PowerPoint)

Why Canva Fails at Accessibility

We don’t have to dig too deep to find the flaws.

When you share visual content digitally, it needs to be readable. So that means when you have an image, you need to have alternate text for those who cannot see the image. Just like you would caption a video for the hearing impaired, you need to add text to your pictures.

The readable text also has to be understandable. If you deliver a pdf with a bunch of text boxes and alternate text, you need them to show up in the proper reading order.

Inside Canva, you currently cannot set the reading order or put in alternate text.

The Wrong Argument

Some people argue that Canva is a graphic design tool, not a content delivery platform. You don’t embed alt text into an image file, you set the alt text when you share the image (for example, you create the image using Canva then set the alt text when sharing via WordPress or Twitter).

But here is the problem with that argument.

Now, as the days move forward, Canva is transitioning into even more of a content delivery platform. You can present a slidedeck directly from canva or share an infographic with a link.

But even beyond that, if you are creating reports using Canva and sharing them as PDFs, you are already past the point where alt text should be added and reading order set.

A Canva PDF Example

Screenshot of a Canva Report Template.
You can find this SDG Progress report template on Canva.

So for this test I just used a Canva template, applied all pages, and then downloaded the 10 page report as a Standard PDF.

Next I’m going to open the PDF report up in Adobe Acrobat Pro.

How to run Accessibility Checks on your Canva Report using Adobe Acrobat Pro

Once open in Acrobat Pro I’m going to click on the “More Tools” button and add Accessibility.

Screenshot of Adobe Acrobat's more tools menu.

Then you’ll want to run an “Accessibility Check.”

Screenshot of an Adobe Accessibility check.

Initial Structure and Alt Text Check

The big surprise is that the document will come out fairly clean. The exported pdf is structured in a way that Adobe recognizes.

Images in Canva’s stock photo library must have a hidden alt text setting based on the document name that translates when you convert to PDF.

But here is a problem. If you were to use any of your own uploaded images, or if you simply wanted to change the alt text on the Canva images, then you would be out of luck without a tool like Acrobat.

Reading Order

So reading order requires a manual check, and you can instantly see a big problem.

Check out page 4. If someone were to try to read this with a screen reader they would hear the text in the following order.

  1. The alt text for the picture of the guy on the right side of the page.
  2. The footer text in the bottom right of the page.
  3. The paragraph under the page header.
  4. The last paragraph on the page.
  5. The second to last paragraph on the page.
  6. The page header “Message from our leaders.”
Screenshot of setting reading order inside of Adobe Acrobat Pro.

To make this document accessible, you are going to have to go page to page manually adjusting the reading order.

Color Contrast

This is another manual check. Let’s go through and see the color combos that need to be legible.

In this report we have…

  • Black Text on a White Background
  • Black Text on a Yellow Background
  • Yellow Text on a White Background
Screenshot of the contrast checker tool by WebAIM.

There are a few ways to check the color contrast, but one is to use this contrast checker tool by WebAIM.

  • Black Text on a White Background (Pass! 21:1 contrast ratio).
  • Black Text on a Yellow Background (Pass! 18.35:1 contrast ratio).
  • Yellow Text on a White Background (Fail! 1.14:1 contrast ratio).

Yea, not a big surprise that the yellow on white Table of Contents header would fail. But if you change out the yellow on white then the contrast is just fine throughout rest of the report.

How to run Accessibility Checks on your Canva Report using Microsoft PowerPoint

So if you are serious about accessibility I would definitely advocate for Adobe Acrobat Pro. Yes it costs money, but Adobe continues to be a leader in accessible design.

That said, you can also check accessibility with PowerPoint.

Screenshot of saving a Canva report as a Microsoft PowerPoint.

The first step is to export your Canva report into Microsoft PowerPoint. Just click on “Share” then “More…” and then scroll down to Save as “Microsoft PowerPoint.”

Screenshot of the report in Microsoft PowerPoint.

The conversion isn’t always perfect. I find that the biggest challenge is usually with the fonts. So you’ll have to do a manual check, scrolling through the document and tweaking any problem spots. You might just need to stretch a text box here and there or reduce a font size.

Another thing to note is that while Canva, or the PDF, would only show you the parts of your file that were within the margins, PowerPoint will show you certain elements that fall outside. For instance, the picture on the Introduction page hangs off the side. The stuff outside the margins won’t print (or be shown when in presentation mode), so this isn’t something that needs fixing. Just don’t freak out.

Once the document looks more or less the same as it did in Canva, go ahead and run your accessibility check.

Screenshot of the Accessibility Check menu item in Powerpoint.

You’ll find the “Check Accessibility” options in the Review tab. Just click the button to run the inspection.

Screenshot of PowerPoint Accessibility Inspection Results.

You’re likely going to find more errors in PowerPoint than in Adobe.

Adding Alt Text

In the Adobe PDF exported from Canva, only the pictures counted as images that required alternate text. PowerPoint is not so sure. It wants alt text for every single color block in addition to the pictures. It also wants you to put in a page title for every page.

Screenshot of Edit Alt Text in Microsoft PowerPoint

If the image doesn’t convey any information (i.e. all the yellow boxes in this report) just click the box below the entry field that says “Mark as decorative.” It will show up with blank text and not be read by a screen reader.

You’ll notice that all of the images that add automatic Alt Text in the PDF version do not in the PowerPoint version. So the setting that sets up alt text when exporting into PDF doesn’t do the same for the PowerPoint save.

Adding Slide Titles

Screenshot of setting a slide title in Microsoft PowerPoint.

If you plan to deliver this report as a PowerPoint, you should also add slide titles.

To add slide titles, go to the slide with the missing slide title. You have three options. You can set an existing text box as the slide title. You can add a slide title. Or you can create a hidden slide title (one that will be read by a screen reader but not seen in the document).

One thing to note, in the conversion from Canva to PowerPoint, some of the text boxes might have been split into two. Some are also grouped with background elements (like the yellow boxes). In order to be set as a title, you’ll want to combine the title text into one box. You also need to ungroup the elements to even see the “set as slide title” option.

Setting the Reading Order

Screenshot of Reading Order in Microsoft PowerPoint.

Okay, reading order in PowerPoint is a bit of a mess. Especially if you have overlapping elements.

It works the same as setting the reading order in Acrobat. Just move elements up and down based on when they should be read.

But here is the thing that will drive you a little nutty. All the decorative elements will show up here, and if your design has overlapping elements (like a title overlapping a picture) you are going to be limited in how you display your reading order.

Why? Because for some odd reason changing the reading order also changes the page display order. And when things overlap, the reading order starts from the back of the group of elements. So if you want a title to slightly overlap over a picture, that picture is going to be read before the title.

Color Contrast

Okay, so this one doesn’t show up in the Accessibility screen, but it’s still an important step. Just follow the same directions as were written out for the PDF approach.

Tips for making Accessibility easier when designing in Canva

There are certain design steps we can take in Canva that will make our Accessibility lives easier.

  1. Use as few text boxes as possible. Meaning, it’s way easier to have one long text box with several separate paragraphs than to have every paragraph in its own text box.
  2. Design with the reading order in mind. Sure, it might feel stylish to put the title in the middle right of the page blended overtop of an image. But that’s just going to be more annoying to make accessible.
  3. Group together decorative elements. By grouping together decorative elements you turn what could be a bunch of elements that need alt text, to a single a element.

If anyone working at Canva is reading this post.

You don’t need to match Adobe on accessibility features. But please advocate for the following features.

  • The ability to add alternate text to visual elements for use in PDF export, and for web display.
  • A reading order pane.
  • An explicit tagging feature (with several levels of header tags & paragraph tags).

The Accessibility Law (aka Section 508)

The concept is pretty simple, if the federal government is providing services and programs over the web, those programs and services should be accessible by its employees and the public, regardless of any disabilities one might have.

This means that the reports you deliver digitally should be readable through a screen reader (including any visuals).

Section 508 (Federal Electronic and Information Technology)

On August 7, 1998, President Clinton signed into law the Rehabilitation Act Amendments of 1998, which covers access to federally funded programs and services. The law strengthens section 508 of the Rehabilitation Act and requires access to electronic and information technology provided by the Federal government. The law applies to all Federal agencies when they develop, procure, maintain, or use electronic and information technology. Federal agencies must ensure that this technology is accessible to employees and members of the public with disabilities to the extent it does not pose an “undue burden.” Section 508 speaks to various means for disseminating information, including computers, software, and electronic office equipment. It applies to, but is not solely focused on, Federal pages on the Internet or the World Wide Web. It does not apply to web pages of private industry.

For more of the legislation you can visit the Rehabilitation Act page on the U.S. Access Board website.

What makes a website or report accessible?

It’s not a checklist or a button.

The best place to start digging into the topic is to check out the Web Content Accessibility Guidelines (WCAG) 2.1. I pulled the following principles from that page.

Understanding the Four Principles of Accessibility

The guidelines and Success Criteria are organized around the following four principles, which lay the foundation necessary for anyone to access and use Web content. Anyone who wants to use the Web must have content that is:

  1. Perceivable – Information and user interface components must be presentable to users in ways they can perceive.
    • This means that users must be able to perceive the information being presented (it can’t be invisible to all of their senses)
  2. Operable – User interface components and navigation must be operable.
    • This means that users must be able to operate the interface (the interface cannot require interaction that a user cannot perform)
  3. Understandable – Information and the operation of user interface must be understandable.
    • This means that users must be able to understand the information as well as the operation of the user interface (the content or operation cannot be beyond their understanding)
  4. Robust – Content must be robust enough that it can be interpreted reliably by a wide variety of user agents, including assistive technologies.
    • This means that users must be able to access the content as technologies advance (as technologies and user agents evolve, the content should remain accessible)

If any of these are not true, users with disabilities will not be able to use the Web.

Looking for resources to help you with Accessibility?

Whether you are looking for tools or just more information, you should definitely check out webaim.org.

Written by cplysy · Categorized: freshspectrum

Apr 26 2022

Leading through Transformation

Photo by Chris Lawton on Unsplash

As I transition out of my role as Director of Innovation Network, I’ve been in deep reflection about how the last 20 years shaped and sharpened my own approaches to learning and evaluation, as well as those of my team and colleagues. The last few years in particular have revealed meaningful lessons about the complexities of creating institutional shifts while navigating through uncertainty and organizational change. These experiences were grounded in the lessons from our transformation toward equity. Each one reaffirmed the importance of leaning into discomfort to shift and broaden our awareness; authentically connecting with each other and those around us to build a foundation of trust; and re-imagining our future from a place of empathy and understanding.

Lean into Discomfort

Leading through this time has emphasized the importance of leaning into discomfort and vulnerability as a pathway for learning and growth. We often intellectualize the world around us to understand and draw meaning from our surroundings. When leading through transformation however, it’s important to explore how our experiences connect to our hearts, not just our minds. As a team, this meant that each one of us had to be willing to engage in deep reflection and at times, challenging conversations with ourselves and each other to interrogate assumptions and create new ways forward. For many of us this meant creating a deeper understanding of our own experiences and perspectives to expand our thinking around what’s possible. At Innovation Network this introspection allowed us to openly share, grow our understanding, and fundamentally shift the way we do things.

Make Authentic and Honest Connection a Priority

While vulnerability, empathy, and curiosity may set a foundation for organizational transformation, it is critical that we make the space and time to connect authentically, both organically and through process. This has been especially important for making sure that we stay rooted in our connection to one another’s experiences as we move through our work. In our organization, this simple but impactful act has led to greater honesty and increased capacity for resolving challenges with consideration for our individual and shared perspectives.

Collectively Re-imagine the Future

Collaboratively re-imagining with the team has been one of the most exciting and revealing parts of the transformation process for the organization and for me personally. While it is easy to fear or resist change, we instead used this time as an opportunity to courageously re-imagine the future from a place of mutual trust, empathy, and empowerment. For us, this has looked like re-imagining our organization, its renewed mission, vision, and values , as well as how we operate and the difference we hope to make. It has also reinforced the importance of community, collaboration, and co-creating with our partners in the field.

I am deeply appreciative of how this process has shaped Innovation Network and my own learning as a leader and community servant. As I part the organization, I employ each of us to continue approaching our work and each other with curiosity, empathy, and heart in our efforts to advance equity and social change.


Leading through Transformation was originally published in InnovationNetwork on Medium, where people are continuing the conversation by highlighting and responding to this story.

Written by cplysy · Categorized: innovationnet

Apr 21 2022

Practical Attractors

Attractor mapping is a method we’ve written about before. It’s a visual means of tracking where we pay attention and where energy is created, sustained and organized.

Energy is represented through attention, action, activity, and interactions. Energy is dissipative and it’s dynamic. This means that we can’t ‘set and forget’ our exploration of attractors. What we learn about where energy is today is likely to change in the near future.

How do we practically use attractors?

Mapping is the key starting point. Mapping, as we’ve described elsewhere, involves paying attention to where patterns of activity are generated. These patterns may be beneficial, problematic, or neutral relative to our goals and needs.

Once the patterns have been identified, it’s important to engage in a sensemaking process to determine what we see and what we imagine might be happening. Sensemaking is a social process that involves looking at data, interrogating it (asking questions about its function, fit, completeness, and patterns), and then devising meaning from it. Ask: what is the significance of what it is that we see? How does what we see fit with what we know and what does it challenge?

Sensemaking is about learning-in-action and making sense of complexity.

Sensemaking, Evaluation and Attractors

With attractors, we are looking at new emergent patterns so it may not be obvious. Consider the example of the early days of the global Pokemon Go game that involved people taking their phones to parks and public squares to play with augmented reality actors. To the untrained eye, this looked bizarre (see the picture above). Yet, when we watch the patterns we see they are shaped by the game, but more importantly, it brings people literally together in the real world. Some of the emergent patterns that came from this were friendships, collaborations (around the game), and a burgeoning community of Pokemon Go players.

The next step is to take the insights we generate from our sensemaking process to align what we learn with what we seek to do. This is connecting strategy and data together. This means clarifying your intent and the desired impactthat your organization seeks.

This is where evaluation comes in. Evaluation can serve as a means to help clarify the strategic intent and take advantage of attractors. Evaluation links intent and action together. This is what the heart of a strategy is all about: aligning the resources, intentions, and actions together to produce an outcome.

Evaluation looks at what is happening through the lenses of strategy and data. It connects the two together.

Putting it into Practice

The lessons for attractors are:

  1. Start with a system. A system is a set of boundaries that contain interactions. These boundaries might be geography, time, markets, populations, contexts or something that helps define the situation you’re looking at. If you look at a system and feel lost, you probably have boundaries that are too broad (try narrowing them, including more constraints). If you constantly are looking outside the system for explanations, you might want to broaden your constraints.
  2. Pay attention. Build observation skills to start looking within a system. What’s happening? Use everything from observation to quantitative data points (e.g., customer numbers, counts, requests, etc..) to stories and more.
  3. Sense make Come together with those who might have different perspectives on your team or beyond to help make meaning from what you see. What patterns did you expect? What surprises you? What’s unknown? What do you need more data on?
  4. Strategize Develop a plan that fits the context. In highly dynamic situations this might mean developing a shorter-term plan. Consider what forces are influencing the attractors and amplifying their effects or whether or not you wish to avoid or dampen those effects if they are not beneficial.
  5. Design Take the steps to design an approach, service, product, policy or overall organization plan to meet these needs. Using the steps in the Design Helix you can gather information and bring all of what you’re seeing together to shape things and create impact.

Repeat these often.

That’s bringing attractors to life in practice.

Do you want or need help in putting this into practice? Would some coaching or strategic advice help you out? If so, reach out and let’s chat over a coffee or tea about how we can help you.

The post Practical Attractors appeared first on Cense Ltd. .

Written by cplysy · Categorized: cameronnorman

  • « Go to Previous Page
  • Go to page 1
  • Interim pages omitted …
  • Go to page 130
  • Go to page 131
  • Go to page 132
  • Go to page 133
  • Go to page 134
  • Interim pages omitted …
  • Go to page 310
  • Go to Next Page »

Footer

Follow our Work

The easiest way to stay connected to our work is to join our newsletter. You’ll get updates on projects, learn about new events, and hear stories from those evaluators whom the field continues to actively exclude and erase.

Get Updates

Want to take further action or join a pod? Click here to learn more.

Copyright © 2026 · The May 13 Group · Log in

en English
af Afrikaanssq Shqipam አማርኛar العربيةhy Հայերենaz Azərbaycan dilieu Euskarabe Беларуская моваbn বাংলাbs Bosanskibg Българскиca Catalàceb Cebuanony Chichewazh-CN 简体中文zh-TW 繁體中文co Corsuhr Hrvatskics Čeština‎da Dansknl Nederlandsen Englisheo Esperantoet Eestitl Filipinofi Suomifr Françaisfy Fryskgl Galegoka ქართულიde Deutschel Ελληνικάgu ગુજરાતીht Kreyol ayisyenha Harshen Hausahaw Ōlelo Hawaiʻiiw עִבְרִיתhi हिन्दीhmn Hmonghu Magyaris Íslenskaig Igboid Bahasa Indonesiaga Gaeilgeit Italianoja 日本語jw Basa Jawakn ಕನ್ನಡkk Қазақ тіліkm ភាសាខ្មែរko 한국어ku كوردی‎ky Кыргызчаlo ພາສາລາວla Latinlv Latviešu valodalt Lietuvių kalbalb Lëtzebuergeschmk Македонски јазикmg Malagasyms Bahasa Melayuml മലയാളംmt Maltesemi Te Reo Māorimr मराठीmn Монголmy ဗမာစာne नेपालीno Norsk bokmålps پښتوfa فارسیpl Polskipt Portuguêspa ਪੰਜਾਬੀro Românăru Русскийsm Samoangd Gàidhligsr Српски језикst Sesothosn Shonasd سنڌيsi සිංහලsk Slovenčinasl Slovenščinaso Afsoomaalies Españolsu Basa Sundasw Kiswahilisv Svenskatg Тоҷикӣta தமிழ்te తెలుగుth ไทยtr Türkçeuk Українськаur اردوuz O‘zbekchavi Tiếng Việtcy Cymraegxh isiXhosayi יידישyo Yorùbázu Zulu