• Skip to main content
  • Skip to footer
  • Home

The May 13 Group

the next day for evaluation

  • Get Involved
  • Our Work
  • About Us
You are here: Home / Archives for allblogs

allblogs

Jun 17 2020

DataViz for Anti-Racism [Free Course]

No new cartoons or lengthy blog post this week.

Instead I launched a course. It only has one module now, but I have plans for more. And did I mention it was free?

Register Here

What you will learn

Not everything that is faced can be changed, but nothing can be changed until it is faced. – James Baldwin

Racism is Systemic

It’s not hard to find inequities in data. All you really have to do is open your eyes.

As an analyst I’ve spent a career with my head in datasets of all sorts. I have been a part of large research and evaluation studies in health, urban development, criminal justice, and education. It doesn’t matter the area of study, when opening a data set that includes data on race and ethnicity, chances are strong that I will see our inequity reflected in the numbers.

As a designer, cartoonist, and blogger, I also know how hard it is to help people see what they would not like to see (self included). The uncomfortable facts that put into question our role in perpetuating a culture of white supremacy and racial inequality.

This is a course about making the numbers real.

There is no need to cherry pick. You don’t need to be super selective to find numbers to share. Numbers that could be used to support anti-racist causes are everywhere, hidden in plain sight and in public data sources.

But if you want the numbers to have an impact, you have to make them real. You have to make them hard to ignore.

That is the point of this course.

Course Structure

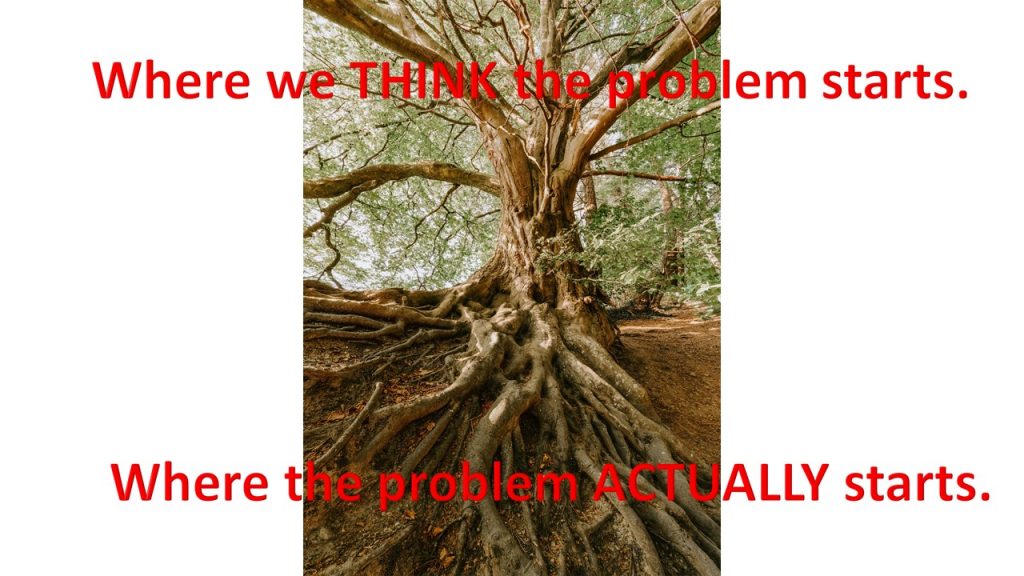
We’ll start with a module on a process I call localizing data.

The concept is simple, one way to make the data real is to show that the trends persist in your backyard. Data shared at federal, and event state, levels are too easy “to other”. To pretend that they don’t apply to your community.

But if you can show that the trends persist even when localized, it makes the numbers harder to ignore.

It also makes it easier to take action. As you can embed the data into your emails to politicians and police chiefs, strengthening your case.

If this course is useful, I’ll make additional modules focused on some other strategies.

Free Forever

I am launching this course for free. And then keep it free.

If you enjoy the course, and want to show appreciation, pay it forward.

Not sure how, here are two suggestions Color of Change and Campaign Zero.

Where do I sign up?

Register Here

Written by cplysy · Categorized: freshspectrum

Jun 17 2020

Try This: Pivot Your Programs & Services

Try this activity and let me know how it goes. As the world began to shelter in place to flatten the curve of the coronavirus pandemic, I did what many social workers do: I checked in on my clients to make sure they were ok. With the exception of one client, all of my client […]

The post Try This: Pivot Your Programs & Services appeared first on Nicole Clark Consulting.

Written by cplysy · Categorized: nicoleclark

Jun 16 2020

Liderazgo en tiempos de Covid-19 (Parte I)

http://www.iesalc.unesco.org/

Ayer hablamos del rol fundamental de la colaboración para el impacto colectivo en el post Preguntas para una evaluación sobre nuestra respuesta a la pandemia: colaboración y trabajo en equipo

Y como ya hemos visto en nuestra serie sobre impacto colectivo, el liderazgo es fundamental para ese tipo de colaboración.

Muy interesante informe, Liderazgo en tiempos de Covid-19 sobre “Cualidades, habilidades y prácticas esenciales” por Doug Reeler y Desiree Paulsen desde Tamarind Tree Associates, con el Equipo de Cultura Internacional de Oxfam, Meg Otieno, Bhavika Patel y Monica Maassen  (abril de 20201)

El papel de l@s dirigent@s y gerentes es mantener el sistema funcionando en tiempo, trabajar con lo que se conoce y es visible, aplicando políticas, procedimientos y planes. Pero cuando enfrentamos una crisis compleja, impredecible e invisible, como el Covid-19, entonces se requiere un liderazgo de una calidad completamente diferente: los líderes deben ser más artistas que científicos, más facilitadores que presidentes, activando el autocontrol en las personas que lideramos. que la regulación de arriba hacia abajo, donde los principios y valores rectores reemplazan las reglas y políticas, donde la preparación es más útil que la planificación, y donde las personas pensantes y su colaboración creativa superan el cumplimiento y la aceptación de los procedimientos establecidos.

  1. Teniendo sentido del contexto global

El desafío es tomarse un tiempo regularmente para agudizar sus perspectivas y aclarar las opciones que tiene, lo que permite una toma de decisiones más sabia, individual y colectiva. ¡Decir que no tenemos tiempo para reflexionar regularmente sobre su situación y desafíos, ya sea sol@s o con otros, no es diferente a los leñadores que dicen que no tienen tiempo para afilar sus hachas!

  1. ¿Liderazgo de control o facilitador?

Invitar al personal a dar su opinión, compartir y discutir sus perspectivas puede permitir que se tomen mejores decisiones, a menudo ahorrando más tiempo después más adelante. Como líder facilitador, preparará y hará preguntas motivadoras, en lugar de dar respuestas rápidas y fáciles. Su objetivo al hacerlo es crear una comunidad inteligente y fortalecer la resistencia del equipo.

También es un momento clave para escuchar dónde se encuentra el personal emocional y enérgicamente para que pueda ver cómo deben ser guiados. ¿Qué están pensando, sintiendo y queriendo? Sé curioso y pregúntales.

  1. Sé consciente del poder y los privilegios

Problemas de diversidad de raza, clase, género, cultura o religión, se vuelven más importantes durante las crisis porque los grupos desfavorecidos generalmente tendrán una experiencia más injusta con menos recursos para amortiguar los golpes, mientras que los grupos más privilegiados pueden permanecer relativamente cómodos y no afectados.

¿Es consciente de cómo las personas de su equipo de entornos desfavorecidos y aquellos que tienen menos recursos y más responsabilidades pueden manejar su vida familiar y laboral? ¿Cómo descubrirlas?

  1. Escuche para aprender y hacer preguntas que estimulen

De todas las habilidades de un líder, escuchar es la más poderosa. Escuchar al personal (a) permite la comprensión, (b) genera confianza y (c) fomenta la relación.  Pero escuchar necesita buenas preguntas abiertas para estimular el intercambio, caracterizado por la curiosidad y la empatía.

Cuando contacta al personal, ¿es solo para pedir información o los llama para interesarse y escuchar sus inquietudes o ideas?

Continuará


Written by cplysy · Categorized: TripleAD

Jun 16 2020

Getting to the Root Cause(s)

It’s so easy to think social problems are simple.

Take interpersonal violence for example. When it is discussed, most people ask, “Why does she stay?”

For a few years in graduate school, I ran a randomized community survey that asked people to tell us what they thought of why violence against women happens and what should be done about it. It’s kind of amazing to hear what people think. Or maybe it’s not.

It’s her fault.

She probably did something to make him mad.

Why doesn’t she just leave?

Rarely, if ever, do people ask, “What is it about our society that allows violence to happen?”

As a community psychologist, I am more interested in this question. (Not sure what a community psychologist does? (Click here to learn more).

As we struggle on through the COVID-19 pandemic and a national identity crisis following the recent (and not so recent) deaths of unarmed black men and women, we literally have to get our head out of the trees. It’s way past time to look at environmental context and root causes. I am not sure about you, but I am tired of plugging holes in the dam. There are just too many of them.

What would it look like if we really lived up to our tag line, Partnering for Social Change? That is the question I asked myself a few weeks ago when I took the week off to rewrite my business plan.

Social change may sound scary, but it really involves questioning our assumptions and recognizing and considering complexity. People live in families, within neighborhoods, within cities, within states, within a country. All of these systems shape us.

I once evaluated a community-based elementary afterschool program whose participants attended a school with a history of low scores on state achievement tests. The afterschool program met for about 2 ½ hours after school. The funder of the afterschool program had an advisory board. During a meeting, the chair of the advisory board said she wanted to set a benchmark that all students would be 100% competent on state achievement tests. That goal, while aspirational, failed to account for the multiple systems that surrounded these students. It put all of the pressure and responsibility on the children, and none on the systems surrounding them. Clearly programs can’t do all things for all people, but if we truly want to make a difference, we have to work on the right levers in the right systems.

Think about a game of Jenga or Pick Up Sticks. Some things are foundational.

So, this is what we will begin to explore. Because if we really want to make a difference, we have to get to the root issues.

Take a moment and consider the program you are running right now. What are the family, community and systems pressures that affect the people you most want to serve?

Your turn.

Written by cplysy · Categorized: communityevaluationsolutions

Jun 16 2020

How to Plan for and Edit Your Own Two-Pager

This week’s dataviz tips come from Tyler Mason, who I met several years ago while leading a training in Indiana. Tyler and I have stayed in touch and he enrolled in additional virtual training with us. Check out how he’s created a two-pager for his program! Great work, Tyler. –Ann

Hi, I’m Tyler Mason, a Juvenile Justice Strategist with the Indiana Juvenile Detention Alternatives Initiative (JDAI). 

This two-pager that I have created was born out of Ann’s “chose the right format” training from her Great Graphs course:

This two-pager that I have created was born out of Ann’s “chose the right format” training from her Great Graphs course.

Here’s how I developed this two-pager.

Know Who Your Audience Will Be

It is vital that you know who your audience will be when developing your charts.

If you don’t follow this critical piece, you may completely miss your audience, and at that point, you may have lost the story you were trying to convey to them.

You will notice with the two-pager I am attempting to communicate the essential data points that I can in a concise way given “one” sheet of paper. 

Select the Right Type of Graph

By utilizing the “choose the right chart” lessons in Ann’s online course, I was able to use the chart that made the most sense with creating the data story.

You will notice that different charts were utilized to tell the data story. For example, we included line charts, bar charts, stacked bar charts, and clustered bar charts.

By utilizing the “choose the right chart” lessons in Ann’s online course, I was able to use the chart that made the most sense with creating the data story.

The first thing as Ann spells out is either draft what you envision on a piece of paper or start brainstorming in your mind.

Through the brainstorming and utilizing Excel, my graphs were born.

Create and Format the Charts on Your Computer

Entering the data and creating the charts is the hardest part, then comes the formatting, which can be the same.

The Less Noise, the Better

One thing as Ann mentions often is the less noise, the better. So, be sure to remove all the noise in the Excel graphs.

Using PowerPoint for Easy Layout Options

Once I had my charts created, I then utilized PowerPoint to lay them out and start telling the story from starting big picture to breaking out what was seen in 2018 for said county on the first page.

When you look at the other side of the page, I start to dig a little deeper into the data and what was seen with length of stay and average daily population.

The last two charts at the bottom are to tell a story about the work that still needs to be done.

Once I had my charts created, I then utilized PowerPoint to lay them out and start telling the story from starting big picture to breaking out what was seen in 2018 for said county on the first page.

How to Frame Your Two-Pager

As a recap, here’s what I considered in my project:

  1. What data are you planning to present?
  2. Who will be your audience, and what is their knowledge level of the data?
  3. Brainstorm ideas to develop your charts from this point forward
  4. Utilize whatever platform you like. I like to use Tableau or Excel. For this current project, I used Excel and PowerPoint.
  5. Start drafting your charts. I also find it valuable to bounce your ideas of your coworkers and what they think of the charts and the story you are trying to tell. I find asking a coworker what they think my data story is trying to tell. If they guess correctly, you’re on the right path. 
  6. Do not forget the formatting of your charts. The less noise, the more people will be engaged. Simple is ideal. Also, another important thing to consider and not forget about is what will my charts look like in black and white and if I used color, are they legible for people with color vision deficiencies. I find that is something that is often overlooked that is also a very vital piece to this equation.
  7. You’re done! Good luck, and as always, be prepared for questions.

The Great Graphs course has been phenomenal and I highly recommend it for anyone needing guidance on how to create the best graphs for your audience.

I hope you find this information worthwhile. Good luck creating your data story.

Written by cplysy · Categorized: depictdatastudio

  • « Go to Previous Page
  • Go to page 1
  • Interim pages omitted …
  • Go to page 255
  • Go to page 256
  • Go to page 257
  • Go to page 258
  • Go to page 259
  • Interim pages omitted …
  • Go to page 310
  • Go to Next Page »

Footer

Follow our Work

The easiest way to stay connected to our work is to join our newsletter. You’ll get updates on projects, learn about new events, and hear stories from those evaluators whom the field continues to actively exclude and erase.

Get Updates

Want to take further action or join a pod? Click here to learn more.

Copyright © 2026 · The May 13 Group · Log in

en English
af Afrikaanssq Shqipam አማርኛar العربيةhy Հայերենaz Azərbaycan dilieu Euskarabe Беларуская моваbn বাংলাbs Bosanskibg Българскиca Catalàceb Cebuanony Chichewazh-CN 简体中文zh-TW 繁體中文co Corsuhr Hrvatskics Čeština‎da Dansknl Nederlandsen Englisheo Esperantoet Eestitl Filipinofi Suomifr Françaisfy Fryskgl Galegoka ქართულიde Deutschel Ελληνικάgu ગુજરાતીht Kreyol ayisyenha Harshen Hausahaw Ōlelo Hawaiʻiiw עִבְרִיתhi हिन्दीhmn Hmonghu Magyaris Íslenskaig Igboid Bahasa Indonesiaga Gaeilgeit Italianoja 日本語jw Basa Jawakn ಕನ್ನಡkk Қазақ тіліkm ភាសាខ្មែរko 한국어ku كوردی‎ky Кыргызчаlo ພາສາລາວla Latinlv Latviešu valodalt Lietuvių kalbalb Lëtzebuergeschmk Македонски јазикmg Malagasyms Bahasa Melayuml മലയാളംmt Maltesemi Te Reo Māorimr मराठीmn Монголmy ဗမာစာne नेपालीno Norsk bokmålps پښتوfa فارسیpl Polskipt Portuguêspa ਪੰਜਾਬੀro Românăru Русскийsm Samoangd Gàidhligsr Српски језикst Sesothosn Shonasd سنڌيsi සිංහලsk Slovenčinasl Slovenščinaso Afsoomaalies Españolsu Basa Sundasw Kiswahilisv Svenskatg Тоҷикӣta தமிழ்te తెలుగుth ไทยtr Türkçeuk Українськаur اردوuz O‘zbekchavi Tiếng Việtcy Cymraegxh isiXhosayi יידישyo Yorùbázu Zulu