• Skip to main content
  • Skip to footer
  • Home

The May 13 Group

the next day for evaluation

  • Get Involved
  • Our Work
  • About Us
You are here: Home / Archives for allblogs

allblogs

Jan 29 2021

How to Present Your Evaluation Timelines: 4 Simple Ideas


Here at Eval Academy we are big fans of keeping evaluation simple and that includes how we present our evaluation timelines. While the level of detail you require is likely different whether you are using the timeline for your own planning purposes or are sharing it with others, these four simple ideas use basic software (think Microsoft Word, Excel, and PowerPoint) to create clean and easy to understand timelines.
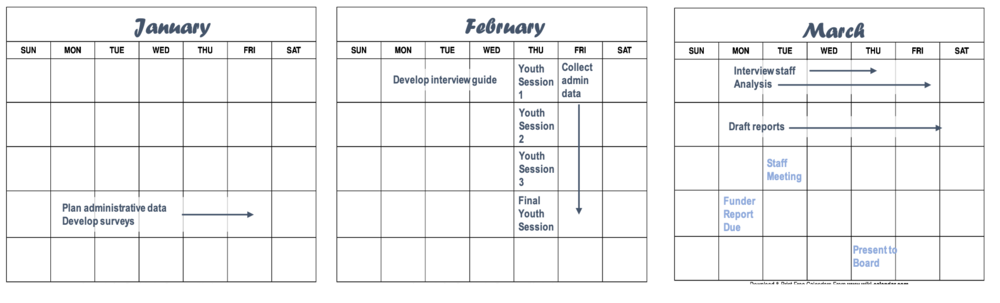
  1. Calendar

    Plot out what needs to happen visually using calendars. A quick online search of “free calendar [month] and [year]” provides you with a plethora of free calendar templates with dates already slotted in. You can add in evaluation milestones and important dates using text boxes and shapes in PowerPoint (or your preferred image editing software), then copy the image into your evaluation plan document.

    This method of visualizing evaluation timelines becomes visually crowded for long projects or overly complicated schedules requiring a lot of detail. Minimizing clutter is the key to a successful calendar visualization (perhaps all visualizations, really).
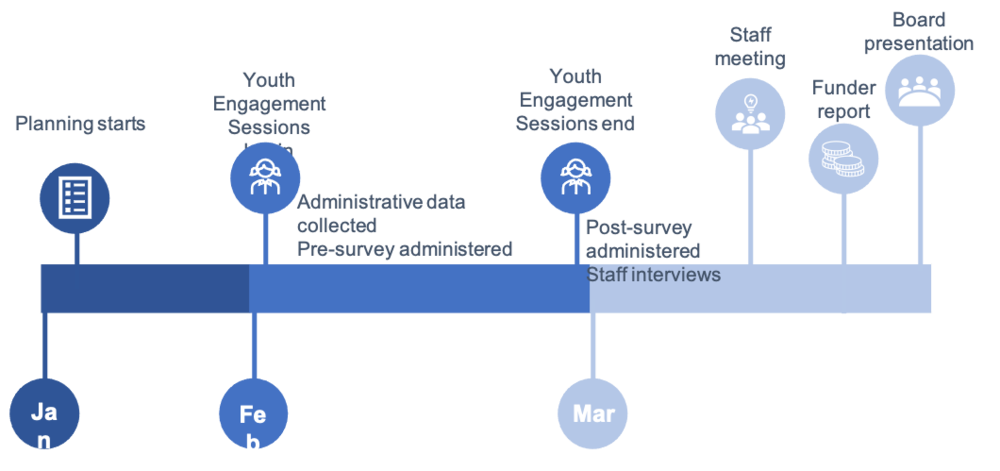
calendar.png

2. Line Graph

A few line and circle shapes put together in PowerPoint or creating an actual line graph in excel can work to highlight key project milestones and high-level timelines. This method of visualizing your evaluation timelines works well when exact dates have yet to be nailed down or in a developmental evaluation where key program milestones will dictate evaluation timing. It’s also great for clients who only need a high-level representation of the work you have planned.
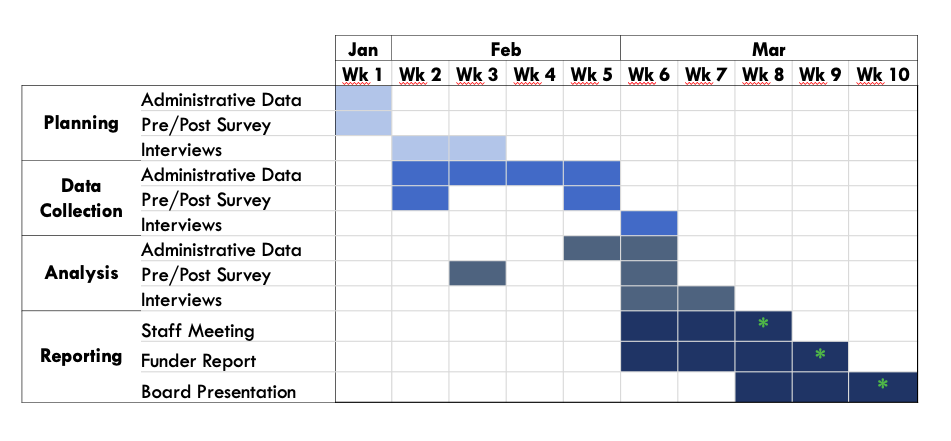
Line graph.png

3. Gantt Chart

Perhaps the most typical method of visualizing project timelines, we prefer a simpler approach than a typical Gantt chart with lines, dependencies, durations, etc. We build ours in excel, slotting in the appropriate timeframes as column headers and use rows for evaluation tasks. We then shade in the corresponding cells to indicate when each task will occur. This method works well when your evaluation timelines change and you can simply copy and paste your cells over to adjust. If you like to get a little fancier, there are some simple Gantt chart templates that are free download, or you can build your own bar chart using Youtube tutorials or your own ingenuity.

Screen Shot 2021-01-20 at 9.58.41 AM.png

4. Chronological List

Maybe not the most visually appealing, but this method of visualization evaluation timelines checks the box for simple and easy to create. Putting the information into a table, then hiding the borders gives your list some easy structure. If you want to get fancy, you can add in colour coding or icons.  

Screen Shot 2021-01-20 at 10.00.27 AM.png

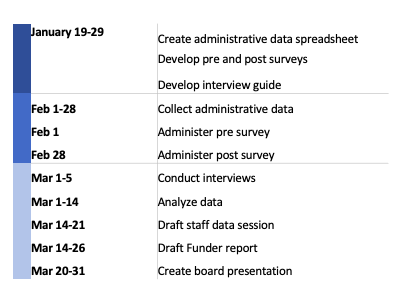
As you can see, a chronological list is easy to understand and you can customize the columns to provide the level of detail required. At Three Hive, we tend to use this method during the budgeting and initial planning process, dividing the tasks into each of our three phases and attaching a cost to each of the items.

Hopefully these four ways to visualization evaluation timelines have demonstrated how simple it is to communicate what you’ve planned for the evaluation and have inspired your creativity for the next time you need to communicate timelines to your team or client.

Want more tips on how to plan your evaluation timelines? Check out this article.


Sign up for our newsletter

We’ll let you know about our new content, and curate the best new evaluation resources from around the web!


We respect your privacy.

Thank you!


Written by cplysy · Categorized: evalacademy

Jan 29 2021

How to Plan Your Evaluation Timelines: 5 Simple Tips


Sitting down to figure out how long your evaluation activities will take can be a daunting process. Evaluations are trickier than programs as they often rely on program timelines and external activities. How can you plan and predict your evaluation activities when they are dependent on other activities? How can you ensure you have the information you need when you need it? This article provides 5 tips to answer those questions and help you create a plan that will actually work for your evaluation.

pexels-startup-stock-photos-212286.jpg

Tip 1: Start at the end

Start by clarifying who needs which information by when. Make sure you clarify expectations about the review process to ensure that you have the correct date. For example, the board may need information for an August 10th meeting, but the information may need to be sent with the board package, which is prepared two weeks in advance, and vetted by the Executive Director who requires at least a week to review the information and suggest changes. This drastically changes your “due date” from August 10th to July 20th or earlier.

Tip 2: Work backwards

Now that you know when the information is required by you can work backwards from this deadline to plot out your data collection and analysis timelines. Estimate how long reporting will take. Block out that time. Plot out any evaluation activities which are directly tied to program activities (e.g. pre surveys need to be sent before program activities, post surveys need to be sent a set amount of time afterwards). Plan to analyze data soon after it is collected whenever possible.

The article could really end here as these are the most important tips, but we do have a few more tricks up our sleeves.

Tip 3: Leave a buffer

Wherever possible, leave your team some wiggle room, especially at the analysis and reporting phases. This gives you extra time when data collection activities inevitably get pushed because program timelines change or when you receive catastrophically bad administrative data which takes an extra week to analyze, or when a team member gets sick. The amount of time you leave for analysis and reporting is one of the few things you can exert the most control over when planning an evaluation and can be the first to disappear if evaluation timelines get compressed.

Tip 4: Be flexible

Change happens. Especially in evaluation. Being clear on your own timelines and constraints (and budget!) means that you can be a bit more flexible when conducting your evaluation. As an evaluator, be prepared to jump on fortuitous opportunities to collect and share data. Program changes can present hidden opportunities to gather more data. Having to move when you analyze your data because the program got extended by another week shouldn’t be the end of the world for your evaluation.

Tip 5: Communicate your timelines clearly and consistently

We cannot stress this one enough. Remind your clients, stakeholders, and teammates of relevant evaluation timelines and do so consistently. Reminding others about your deadlines and communicating when you need information by and why (i.e. there’s a hard deadline for the board report) can help ensure that you get what you need when you need it. For some clients, a weekly or monthly status report can signal what information is needed to keep the evaluation on track and delayed data can be presented as a risk; while for others, simply adding evaluation data provision as an action item in a meeting works just fine.

With these five tips under your belt you should be well on your way to planning a well thought out evaluation.

If you need ideas for how to visualize your evaluation timelines, check out 4 different ways in this article.

Sign up for our newsletter

We’ll let you know about our new content, and curate the best new evaluation resources from around the web!


We respect your privacy.

Thank you!


Written by cplysy · Categorized: evalacademy

Jan 28 2021

Función de evaluación descentralizada en el Sistema de Naciones Unidas

Fuente: https://www.flacso.edu.ec/

Continuando con el pasado post sobre “La función de evaluación central en el Sistema de Naciones Unidas“, la evaluación descentralizada se planifica, gestiona y realiza fuera del departamento de evaluación central de una organización. En un principio se la denominó “autoevaluación”, pero ese término se abandonó debido a que la autoevaluación figuraba incluso en algunas funciones centrales.

Las evaluaciones descentralizadas se sitúan fuera de la Oficina Central de Evaluación, en las oficinas o dependencias de programas junto con funciones de la dirección ejecutiva o de gestión que responden de la planificación y ejecución de proyectos y programas. Esto incluye proyectos y programas en los niveles o departamentos de las oficinas técnicas, regionales y en los países.

Así pues, la función de evaluación descentralizada suele operar como parte esencial de la gestión de los programas e incluye la evaluación, el seguimiento y otras actividades analíticas conexas con el fin de apoyar la adopción de decisiones asociada a las distintas etapas de la ejecución de proyectos y programas.

Desde el punto de vista estructural, las evaluaciones descentralizadas de ese tipo no son independientes del control de los directores de los programas por lo que respecta a la planificación, gestión, realización y aprobación de la evaluación, así como la presentación de los informes correspondientes. Esto es aplicable tanto a (1) las evaluaciones gestionadas y realizadas a discreción por el personal de los programas como a (2) las evaluaciones encargadas o contratadas a consultores externos, en algunos casos donde los directores de los programas incluso dan la aprobación final del informe.

-Las evaluaciones descentralizadas no independientes las lleva a cabo el personal, o se encargan a consultores externos bajo el control de la dirección ejecutiva por lo que respecta a la planificación, la elaboración y la presentación de informes.

-Las evaluaciones descentralizadas independientes se planifican a nivel descentralizado y en otros niveles bajo el control de otros órganos independientes fiables, y la aprobación final y la publicación del informe son independientes. No obstante, su credibilidad en tales circunstancias depende de la transparencia en cuanto a la participación de interesados clave.

Fuente: ANÁLISIS DE LA FUNCIÓN DE EVALUACIÓN EN EL SISTEMA DE LAS NACIONES UNIDAS (2014)

Written by cplysy · Categorized: TripleAD

Jan 27 2021

How to Create Icon Arrays in Adobe XD

This is the second in a series of posts on chart design in Adobe XD. In each post we will take on a different chart type. Today we’ll talk about one of my all time favorite charts, the Icon Array.

What you’ll find in this post:

  • An Oversimplified How To
  • How to do more with your Icon Array.
  • Icon Array Inspiration
How to Create Icon Arrays in Adobe XD Illustration

An Oversimplified How To

Creating a bar chart (or column chart) in Adobe XD is just a little shape creating.

Adobe XD Icon Array Illustration How To 1

Step 1. Start by creating an artboard in Adobe XD. It doesn’t matter which you choose, you can create multiple artboards of different sizes within each Adobe XD file.

You should also have some data… I’ll just use some random numbers: 7, 8, 12, 14, 19.

Adobe XD Icon Array Illustration How To 2

Step 2. Draw a square by clicking on the little square icon and drawing it on the artboard (you can also change the fill color if you’d like). It’s okay if it’s not a perfect square, we’ll fix that in the next step.

Adobe XD Icon Array Illustration How To 3

Step 3. Adjust the size of the square using the panel in the upper right hand of the screen. I’ll make mine 50 pixels wide by 50 pixels tall.

Adobe XD Icon Array Illustration How To 3

Step 4. Use “repeat grid” to copy the square across, till you have the number you want to visualize (in my case, 7).

Adobe XD Icon Array Illustration How To 4

Step 5. Now Copy/Paste your Grid so you have 5 rows, then drag them apart to create the series.

Adobe XD Icon Array Illustration How To 5

Step 6. Now drag out each row until the number of boxes match the frequency you are trying to visualize.

And there you go, you have an icon array chart.

How to do more with your Icon Array.

Okay, so now you know the basics, let’s look at what else you can do. Adobe XD is a design program, not a spreadsheet. What you lack in automatic charting, you gain in complete control over formatting.

Stretch and Skew

Adobe XD Icon Array Illustration Sketch and Skew

Adobe XD is a vector design program, so you can stretch and skew to your heart’s content without sacrificing quality. Usually I will ungroup all of my individual grids, then group all the squares together. This lets me lock the proportions and turn off the responsive resize. This let’s me move the chart around without changing the initial look.

Adding Color

Adobe XD Icon Array Illustration adding Color

Add color by just selecting a square and then clicking on the box next to “Fill/Border.”

Adding Labels

Adobe XD Icon Array Illustration  Adding Labels

Add labels by clicking the “T” icon and entering the text somewhere on the page. You can easily shift the text placement, change the size, change the font, or change the color.

Adjusting the Art Board

Adobe XD Icon Array Illustration  Adjusting the Art Board

Adjusting the art board is as simple as adjusting the size of any shape within the artboard. Just click on the artboard title, you’ll be given the ability to drag the sides (or you can just change the pixels in the W & H boxes on the right side of the page).

Shapes, Icons, and Pictures

Adobe XD Icon Array Illustration  Shapes, Icons, Pictures

You can create an icon array using this approach with any kind of icon you have. It can be shape you’ve drawn (like the first example), an icon you pulled from a site like the Noun Project, or a picture (like the Bernie Sanders meme cutout).

Alternate Shapes and Sizes

Adobe XD Icon Array Illustration Alternate Sizes and Shapes

You can also copy/paste or duplicate artboards. This lets you create all sorts of different shapes and sizes for different dissemination tools.

Beyond the Basics

Adobe XD Icon Array Illustration Bernie Boxes
Icon Array Example with Annotated Rows

This is just the basics. There are all sorts of things you can do with Icon Arrays in XD.

Icon Arrays, in my personal opinion, are vastly underutilized. Most of your basic charts (bar charts, line graphs, pie charts, etc.) don’t show you the values underlying the visual.

For example, say you have two equal bars, each would show you 50%. In one chart you have an “n” of 2. In the other chart you have an “n” of 1,432. These are very different datasets but the bar charts would look identical. The icon arrays would provide you with more depth.

Icon arrays can also help you individualize the data. If each point represents a person, knowing that as a reader can help you connect with the data.

Icon Array Inspiration

Or, go big-picture with icon arrays. I love this approach, and the school district did, too.
Depict Data Studio – Students Receiving Free and Reduced Meals: From Nested Donuts to an Icon Array

So this Icon Array by Ann K Emery is a pretty simple visual. A lot of Icon Arrays you see in the wild tend to be alternative pie charts using a base 10, 100, 1,000, etc. and highlighting a proportion.

Icon Array of Senate Results from 2018 Election
VOX Midterms 2018

Icon arrays have been seen more often in election data in recent years. This icon array mimics the look of the U.S. Senate chamber.

Icon arrays can also make really easy interactive visuals. Take this Senate chart for instance, each dot represents a senator. If you wanted, you could create an interactive version where you highlight a dot and the individual Senator appears in a pop-up box.

Icon Array of Suicide by Gun Death
Gun Deaths in America – FiveThirtyEight

Icon arrays also make for really good story telling visuals. It let’s you dive into the data, using annotations to highlight individuals as well as groups of people.

If you’re interested in a short course on icon array design, part of my free Data Viz for Anti-Racism course walks through the process of creating an icon array infographic.

Icon Array from DiY Data Design
Icon Array Infographic – from my Free Data Viz for Antiracism Course
Cartoon by Chris Lysy - freshspectrum - 
"33.33% of respondents loved our program."
"Be honest. You only talked to 3 people, right?"
Don’t do this with your axis…

Written by cplysy · Categorized: freshspectrum

Jan 26 2021

Use Google Maps to explore your data in a new way

Isn’t it so gratifying to learn a new skill and get to apply it?

One thing I’ve been learning lately is how to use ArcGIS, a super fancy mapping tool that allows you to collect, analyze, and visualize all sorts of data. 

I’ve talked about mapping with clients and at conference presentations for awhile, and I’ve loved using public (read: FREE) mapping tools to learn more about the communities I was serving or studying. 

I’ve used maps in many ways – describing the community for grants or needs assessments, determining which students need home visits, or figuring out which resources are near students’ homes.

Most recently, I’ve gotten to use maps through my part-time work as a researcher at Ohio State.

We were trying to figure out if the students in our college had practicum placements within federally designated “medically underserved communities.”

Using a free public map file from a government agency and uploading a list of addresses where our students were placed, I was able to instantly visualize and (through ArcGIS’s fancy tools) analyze the percentage of our students working within underserved communities. 

Seeing it all come together was magical. 

It painted such a clear picture of the impact of our college and the difference that our students are able to make. 

Given the disproportionate impact of COVID-19 on disadvantaged communities and the rising awareness of systemic racism on, well, every aspect of community life, knowing what children and families need outside of school – and acting on it — is critical.

Using data to pinpoint which students are at the greatest risk of disengaging from online school or whose families struggle to meet basic needs is essential for targeting interventions and outreach.

Here’s a list of free mapping tools to get you started ​(from my May post on the AEA365 blog): 

Demographics

  • U.S. Census Bureau QuickFacts and Data Explorer
  • Income Segregation Maps (Stanford Center on Poverty and Inequality)
  • KIDS COUNT Data Center (Annie E. Casey Foundation)

Education

  • School and Community Factors that Affect Learning (Brookings Institution)
  • School Zones and Segregation (Vox)
  • Education Data Explorer (Urban Institute)
  • NAEP Report Cards – Data Tools

Health

  • U.S. Department of Health and Human Services Datasets
  • USDA Food Access Research Atlas
  • Air Pollution Map (Center for Public Integrity)
  • HRSA Mapping Tool
  • COVID-19 Dashboard (Johns Hopkins University)

City and county agencies also have amazing resources. See if your health or police departments, school districts, or universities have online tools for exploring your area.

Here’s a map I created of the schools, hospitals, and other services where I live, from the city’s mapping tools:

Picture

To get started mapping your own data, I always recommend starting with Google Maps!

Beyond being a lifesaver for those with a poor sense of direction like me, Google Maps offers a free tool for creating your own maps. You can map multiple data sources and use colors, symbols, and labels to make sense of your data.

To get there from the Google Maps page, click on the three lines at the top left of your screen (see image below). 
Picture

Then, go to “Your places” (highlighted in blue below).
Picture

Finally, in the “Your places” menu, click the “Maps” tab on the right and then “Create Map” at the bottom. 
Picture

Then go play! See what maps you can create of your community.
​
Now think about each of your students and families as dots on that map. Imagine what they might see every day when they walk down the street. What resources are available to them in their community? In what ways is their community potentially putting them at risk?

You can use what you learn from your mapping explorations to influence survey questions and interview protocols for students and families. For example, if there has been a recent rise in crime rates in a neighborhood, ask families and students if they feel safe and what the school or district could do to make them feel safer.

Certainly, your findings can also help you figure out what services to offer within your program or school. ​

It’s been so enjoyable to build my mapping skillset and explore a whole new way of looking at data. I hope you take some time to play around with these mapping tools and see what you can learn!

Written by cplysy · Categorized: engagewithdata

  • « Go to Previous Page
  • Go to page 1
  • Interim pages omitted …
  • Go to page 208
  • Go to page 209
  • Go to page 210
  • Go to page 211
  • Go to page 212
  • Interim pages omitted …
  • Go to page 310
  • Go to Next Page »

Footer

Follow our Work

The easiest way to stay connected to our work is to join our newsletter. You’ll get updates on projects, learn about new events, and hear stories from those evaluators whom the field continues to actively exclude and erase.

Get Updates

Want to take further action or join a pod? Click here to learn more.

Copyright © 2026 · The May 13 Group · Log in

en English
af Afrikaanssq Shqipam አማርኛar العربيةhy Հայերենaz Azərbaycan dilieu Euskarabe Беларуская моваbn বাংলাbs Bosanskibg Българскиca Catalàceb Cebuanony Chichewazh-CN 简体中文zh-TW 繁體中文co Corsuhr Hrvatskics Čeština‎da Dansknl Nederlandsen Englisheo Esperantoet Eestitl Filipinofi Suomifr Françaisfy Fryskgl Galegoka ქართულიde Deutschel Ελληνικάgu ગુજરાતીht Kreyol ayisyenha Harshen Hausahaw Ōlelo Hawaiʻiiw עִבְרִיתhi हिन्दीhmn Hmonghu Magyaris Íslenskaig Igboid Bahasa Indonesiaga Gaeilgeit Italianoja 日本語jw Basa Jawakn ಕನ್ನಡkk Қазақ тіліkm ភាសាខ្មែរko 한국어ku كوردی‎ky Кыргызчаlo ພາສາລາວla Latinlv Latviešu valodalt Lietuvių kalbalb Lëtzebuergeschmk Македонски јазикmg Malagasyms Bahasa Melayuml മലയാളംmt Maltesemi Te Reo Māorimr मराठीmn Монголmy ဗမာစာne नेपालीno Norsk bokmålps پښتوfa فارسیpl Polskipt Portuguêspa ਪੰਜਾਬੀro Românăru Русскийsm Samoangd Gàidhligsr Српски језикst Sesothosn Shonasd سنڌيsi සිංහලsk Slovenčinasl Slovenščinaso Afsoomaalies Españolsu Basa Sundasw Kiswahilisv Svenskatg Тоҷикӣta தமிழ்te తెలుగుth ไทยtr Türkçeuk Українськаur اردوuz O‘zbekchavi Tiếng Việtcy Cymraegxh isiXhosayi יידישyo Yorùbázu Zulu